The following technical insight is part of an occasional series authored by Greg McMillan, industry consultant, author of numerous process control books and a retired Senior Fellow from Monsanto. This insight was adapted from Greg's book Advanced pH Measurement and Control.
The pH electrode offers by far the greatest sensitivity and rangeability of any measurement. To make the most of this capability requires an incredible precision of mixing, reagent manipulation, and nonlinear control. pH measurement and control can be an extreme sport.
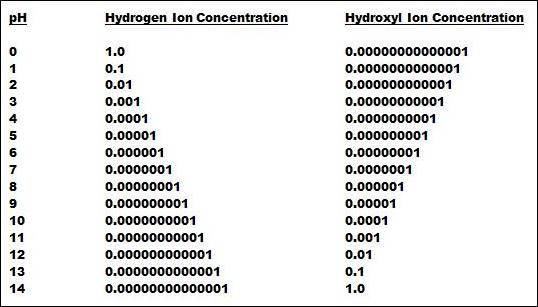
At the neutral point, the concentration of hydrogen and hydroxyl ions is by definition equal. If the temperature is 25oC, the pKw is 14.0, which the means the pH is 7 and the hydrogen and hydroxyl ion concentrations are both 10-7. Table 1 (below) shows how the hydrogen and hydroxyl ion concentrations change by a factor of 10 for each pH unit.
Table 1 illustrates the heart of the matter. No other type of commonly used measurement covers such a tremendous range. Also, the pH electrode can respond to changes as small as 0.01 pH, which means the pH measurement can track changes as minute as 0.000000005 in hydrogen ion concentration at 7 pH. No other commonly used measurement has such tremendous sensitivity. As with most things in life, you don’t get something for nothing!
The rangeability and sensitivity capabilities create associated control system design problems that can seem insurmountable. It is important to realize that these problems are due to attempting a level of performance in the pH process in terms of concentration control that goes well beyond the norm. For a strong acid and strong base control system, the reagent valve must have a rangeability greater than 1,000,000:1 for an incoming stream that varies between 0 and 6 pH and a setpoint at 7 pH. The stick-slip of the same control valve must be less than 0.00005 percent to control within 1 pH of the 7 pH setpoint. How then is this possible? Such strong acid and base systems are controlled by approaching the setpoint in stages and using successively smaller precision control valves. The multiple state requirement of pH control can be visualized be comparing it to trying to sink a golf ball in the hole on a green. The distance between the tee and the green presents the rangeability requirement and the size of the hole compared to the distance represents the sensitivity requirement. For the above strong acid and strong base system, the tee would be about a million yards from the green. A hole in one is impossible. Using the same large control valve at each state is like the joke about the gorilla who drives the green in one stroke but then uses his driver again and hits the ball the same distance when he tries to putt.
Fortunately, true strong acid and base systems rarely exist. Just the exposure of the liquid to air will result in the absorption of enough carbon dioxide to add a weak acid to the system that greatly moderates the extreme changes in titration curve slope and hence process gain.
The logarithmic relationship between pH and hydrogen ion activity as seen in equation 1.1b offers the ability to measure hydrogen ion activity (concentration for dilute aqueous solutions) from 1 to 10-14 over the 0 to 14 pH scale range. In fact, pH measurements below 0 and above 14 are possible, which extends the rangeability beyond 14 orders of magnitude.
aH= 10-pH (1.1a)
pH = - log (aH) (1.1b)
aH= g *cH (1.1c)
where:
aH= hydrogen ion activity (gm-moles/liter)
cH= hydrogen concentration (gm-moles/liter)
g = activity coefficient (1 for dilute solutions)
pH = negative base 10 power of hydrogen ions
The hydrogen activity is the effective concentration and is a measure of the ability of the hydrogen ion to move and combine with other ions. For dilute solutions the effective and actual concentrations are equal and the activity coefficient is one. For solutions with high concentrations of ions, the crowding and presence of other charges reduces the activity coefficient to less than one and the effective is less than the actual concentration. There are also activity coefficients for acid and bases that affect pH. For solutions with less than 90 percent by weight water or more than 5 percent by weight salt, the pH becomes a noticeable function of water and salt besides hydrogen ion concentration.
The product of the hydrogen and hydroxyl ion concentrations must equal 10 raised to the minus power of the water dissociation constant (pKw) per equation 1.1d for water solutions. The pKw and thus the actual solution pH is a function of the process temperature. In the pH titration curve chapter we will find out how other dissociation constants can cause the solution pH to change. The standard temperature compensator corrects for the effect of temperature on the signal developed by the electrode. Smart transmitters have recently added the option for user to program for the correction of effect of temperature on the solution pH. The exact relationship between temperature and solution pH is not generally available and needs to be developed from lab tests except possibly for strong bases solutions above 7 pH where the effect is primarily due to the change in pKw with temperature.
cH* cOH= 10-pKw (1.1d)
where:
cH= hydrogen concentration (gm-moles/liter)
cOH= hydroxyl concentration (gm-moles/liter)
pKw = negative base 10 power of the water dissociation constant (14.0 at 25oC)
Advanced pH Measurement and Control by Greg McMillan and Robert Cameron provides a clear, concise, and comprehensive view of how to select, install, and maintain electrodes, control valves, and control strategies for pH applications critical for product and water quality in the process industry. The book covers every aspect of system design including the mixing and reagent piping requirements that are important for a successful application.
pH measurement and control offers a degree of precision in concentration control that is orders of magnitude beyond what is possible with any other analytical measurement. This incredible opportunity has inherent challenges that can be addressed by a gaining knowledge of the nonlinearity, the equipment and piping design requirements and electrode technology. There are many pitfalls any of which can make a pH control system not only perform badly but fail miserably. Here is a set of insights gained from over 40 years of working on pH systems.
- The actual solution pH changes despite a constant hydrogen ion concentration because of changes in dissociation constants with process temperature, and activity coefficients with ionic strength and water content.
- There are no straight lines in a titration curve. A zoom in on any line should reveal another curve if there are sufficient data points.
- The flatness of the titration curve at the set point has the greatest effect on the tightness of pH control. The next most important effect is the distance between the influent pH and the set point.
- The titration curve is the essential tool for every aspect of pH system design and analysis.
- The first step in the design of a pH system is to generate a titration curve at the process temperature with enough data points to cover the range of operation and show the curvature within the control band (absolute magnitude of the difference between the maximum and minimum allowable pH).
- For a set point on the steepest part of the titration curve, one stage of neutralization is needed for every two pH units away from set point. Accurate feedforward control and precise valves can eliminate one stage.
- There is a huge opportunity to reduce reagent usage and capital investment by simply moving the set point to a flatter part of the titration curve and closer to the influent pH.
- The use of a static mixer or pump as a fast inline pH system can eliminate the need for a well-mixed vessel for the first stage even for a set point on the moderately steep part of a curve by the judicious use of a signal filter.
- The average or filtered signal pH will not equal the actual pH downstream because of measurement errors and noise and the titration curve.
- The volume of each stage should differ by a factor of five to minimize resonance with the smallest volume first to minimize recovery time.
- A poorly mixed tank should never be used for pH control but can be effectively used to attenuate oscillations from an upstream pH loop.
- Most of the problems with reagent throttling and injection stem from the extremely low flows required for pH control.
- Most of reagent valves are oversized which increases the amplitude of the oscillations from stick-slip.
- Make sure valve sizing calculations take in account any transition to laminar flow and viscosity correction.
- Use precision machined industrial sliding stem (globe) valves with digital positioners tuned for the small actuator volumes to minimize stick-slip.
- If the trim will plug, use pulse width modulation and set the ratio of the maximum to minimum pulse width to achieve the desired rangeability.
- The reproducibility of commonly used electrodes is about 0.2 and 0.05 pH for the steep and flat portions of a titration curve, respectively if the process is nice and the electrodes are properly selected, installed, and maintained.
- When the reproducibility must be better than 0.05 pH, use a pressurized flowing junction reference electrode with a reference fill solution that is compatible with the process.
- For really nasty process fluids that seriously shorten the life expectancy of the electrode because of chemical attack, abrasion, dehydration, or coating, use an automatically retractable and sequenced assembly to minimize the electrode’s process exposure and maximize its conditioning and calibration.
- The reproducibility of a measurement electrode depends upon the condition of a thin fragile gel layer that is easily disrupted by abrasion, dehydration, high temperature and chemical attack.
- The reproducibility of the reference electrode depends upon its internal electrolyte ions quickly establishing and maintaining contact with the process but the process not clogging or migrating into the reference junction.
- The measurement electrode glass type and reference electrode junction and fill must be compatible with the process composition and temperature.
- Smart Transmitters should be used to continually monitor resistances to infer the condition of the glass surface and the reference junction.
- The use of 3 electrodes and middle selection will maximize the reliability and minimize the maintenance unless the process is so nasty it causes premature electrode failure.
- The approach to the neutral point looks like a runaway response due to acceleration.
- Signal characterization of the controlled variable is a powerful tool for linearization if the set point is on the steep portion of a fixed titration curve but may be counterproductive to prevent excursions into the steep region for set points on the bend in the curve.
- The combination of adaptive control with signal characterization can be a powerful “one-two punch” to eliminate nonlinearities.
To properly design a pH control system, you must have a titration curve at operating conditions to assess the extent of the nonlinearity. From the slope of the titration curve in the operating point and the distance to setpoint for the most extreme conditions you can determine the number of neutralization stages, control valve precision, mixing uniformity, linearization, and special automation system design requirements such as middle signal selection. A successful pH control system requires a close working relationship between automation engineers, mechanical engineers, process engineers, suppliers.


