

Vibration measurement for machine condition monitoring has evolved from the simple screwdriver to advanced AI applications. This article traces some of its developments.
In the absence of instruments, vibration has been “evaluated” by means of touching the machine, transfer of the vibration signal from the source to the head with the aid of a rod, or by using a doctor's stethoscope. In each of these cases, the signal is evaluated by experience without the aid of numerical values to aid comparison.
Over the years it has evolved to:
- Mechanical levers, which measures displacement
- Eddy Current Measuring displacement (Primarily API 670), still extensively used for absolute displacement measurements
- Analysis of Orbit plots for shaft runout
- Velocity pickup, which measures velocity-induced voltage (e) proportional to: Magnetic field (b), length of windings (l), and relative velocity (v).
- Piezoelectric accelerometer and its evolution to the ICP/IEPE/CCLD accelerometer (the accelerometer is the most used in view of its large frequency range and dynamic range). Due to the high impedance and low signal levels at the output of a piezoelectric accelerometer, it is nearly always necessary to use preamplifiers before entering common instrumentation. With the new ICP/IEPE/CCLD accelerometer, the conditioning and power supply is normally built into the DAS.
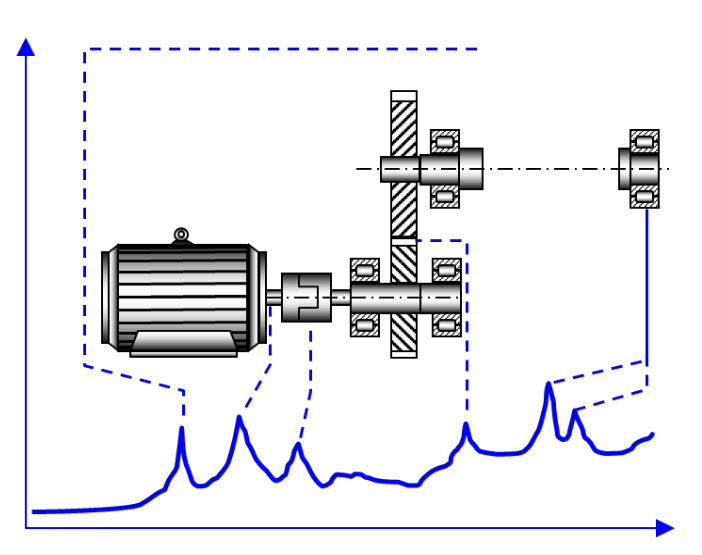
The frequency spectrum gives in many cases detailed information about the signal sources which cannot be obtained from the time signal. The example below shows measurement and frequency analysis of the vibration signal measured on a gearbox. The frequency spectrum gives information on the vibration level caused by rotating parts and tooth meshing. It hereby becomes a valuable aid in locating sources of increased or undesirable vibration from these and other sources.
 Initial systems were only for alarm and trip—evolving to advanced real-time frequency analysis, order analysis with displays like Waterfall, Campbell, etc. From frequency analysis, the systems have evolved in-line with new technologies such as artificial intelligence (AI) and machine learning.
Some terminologies for signal and system analysis are:
- Fast Fourier Transform (FFT)—A fast method for computing the discrete Fourier transform.
- Auto Spectrum—Frequency domain signal Gx(f) = FFT (Linear Spectrum, complex) Gxx(f) is real (not complex). Amplitude information only, no phase.
- Cross Spectrum—Frequency domain signal Multiply 2 different FFTs. Characterizes relationship between 2 signals Complex function of frequency Shows transmission amplitude and phase characteristics between two signals.
- Coherence—Calculated by dividing the cross-spectrum between the excitation and response by the product of the auto-spectra for the excitation and response. Gives the correlation between excitation and response signals in Frequency Response Function (FRF).
- Frequency Response Function (FRF)—Characterizes the relationship between an excitation and a response signal. Complex function of frequency synonymous with Transfer Function. Two ways to compute: H1(f) and H2(f).
- Order Analysis—A form of frequency analysis, used with rotating machines, where the amplitude of the signal frequency components is plotted as a function of multiples of the rotating frequency.
Special techniques were incorporated to meet criteria like API 670, redundant system, and intrinsic safety requirements. From wired sensors, technology has evolved to wireless sensors and standards compliance like ISA 100. An important criterion is also the calibration of sensors and completed systems. These range from simple handheld systems and tabletop systems to completely computerized calibration systems with NIST traceability and compliance to ISO 16063.
Application domains are primarily rotating machine analysis and structural testing. Some of the industries where vibration measurement and analysis are done extensively are:
- Aerospace
- Automotive
- General Engineering
- Process Industries
- Research
