At one time, process historians were simply software packages used to store and present real-time process data. Today, however, historians are being used to do much more.
Process historians are being used to store ever-increasing amounts of big data originating from a much wider variety of sources, including control and monitoring, laboratory information management, enterprise resource planning (ERP), and asset management systems. Organizations are also using them to transform this and other data into actionable information to implement and improve equipment diagnostics, maintenance, safety, alarms, production, performance, and other process plant activities. Finally, historians are an essential part of integrating the enterprise, acting as a hub to distribute this information throughout the enterprise in various formats via company intranets, the Internet, and the cloud.
This blog explores the changing role of process historians and illustrates how these concepts are being used in process plants worldwide with application examples.
Deluge of data
At one time, historians were fed data primarily by the process control system, usually a distributed control system (DCS). Older historians relied on a proprietary database, which often limited user access and made it difficult to interface with other plant information systems. Now, thanks to more universal and open interface technologies-such as OPC, Ethernet, and SQL-many more external systems can send and access historian data (figure 1).
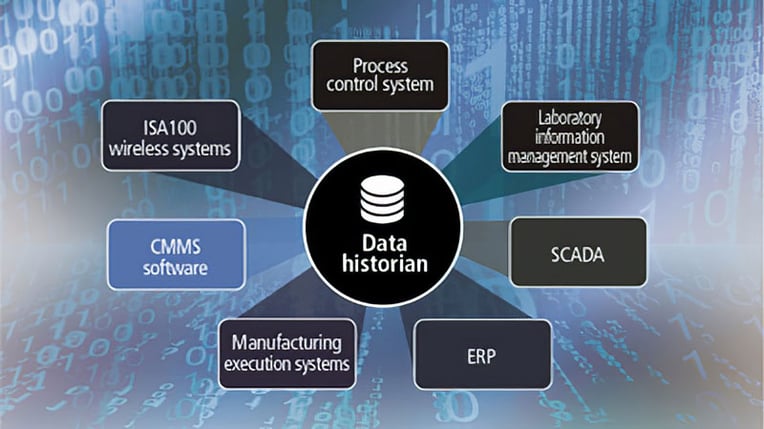 Figure 1. Data can flow into and out of a modern historian from a variety of sources.
Advances in the Industrial Internet of Things (IIoT), including the increasing popularity of ISA100 wireless instrumentation, provide another source of data. If a plant has 100 ISA100 transmitters, each broadcasting once every six seconds, the historian could receive tens of thousands of data points every hour. These data points include the process variable, diagnostics, alarms, and events.
Modern historians no longer rely on a simple proprietary database stored on a local computer to deal with this big data. New SQL-based deployment architectures now support the cloud and centralized and decentralized architectures-and can consolidate data from local to corporate-level historians.
Various data-handling techniques are employed to deal with this big data, including filtering, time stamping, and combinations of flat-file and relational databases. For example, many of the data points coming from wireless instruments rarely change; therefore, the historian stores only those variables changing outside a predefined range, a form of reporting by exception. Devices themselves are becoming more intelligent, and with edge computing only the data that is of importance is given to the historian.
Data to actionable information
In the past, data from historians was primarily used to analyze processes and control functions. Engineers would write software to generate trends and graphs, and then try to visually analyze this process historian data to spot anomalies and areas for improvement. Spreadsheet software was the tool of choice, but it took a lot of work and expertise to make this general-purpose tool perform this specialized task. In many cases, data scientists had to be engaged to assist.
Now that data in modern historians is more readily available via the use of standard SQL structures and open interfaces, it is possible to use commercially available software for analysis and reporting, integrating with corporate standards and removing the need for specialist skills. Historian suppliers and system integrators have created a wide variety of specialized analysis packages (figure 2) for alarm management, safety system monitoring, asset management, mass balancing, off-sites management, and power and energy consumption. In many cases, these application packages were developed by suppliers and users to solve specific end user problems and challenges, and then they were made into universal solutions available to other users.
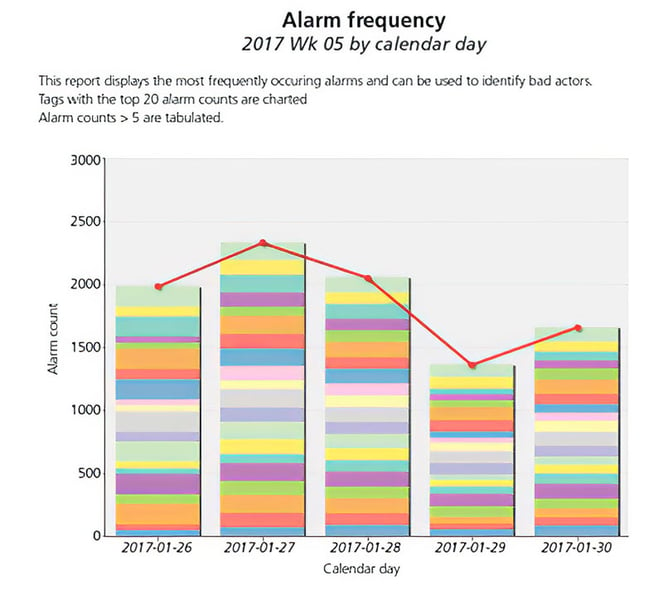 Figure 2. Specialized packages can be used by any system.
Distributing information
Thanks to the cloud, IIoT, and open interfaces, historian data can now be made available to anyone and any software system with proper access credentials. As shown in the applications section, historian data can be viewed locally, globally, and from centralized locations. For example, a dashboard display for an alarm monitoring application allows engineers to "drill down" into alarm activities. Clicking one of the colored discs in a heat map might take the user to the chattering alarms report, prefiltered for the day of interest. The user can continue to drill down until ultimately the raw alarm and events are displayed, which can be used for root-cause analysis and displaying filtered events before, during, and after an alarm incident.
This capability allows engineers at a central location to monitor conditions from company sites all over the world-but it also allows engineers at each plant to see the same data as it applies to their specific plant.
In addition, users are no longer limited to accessing historian data via a local PC. Data can be viewed on any desktop PC, laptop PC, smartphone, or tablet connected to the corporate intranet or to the Internet (figure 3).
What is possible with today's historians? With the availability of application packages and open interfaces, virtually any kind of analysis of plant data is now possible, as shown in the examples below.
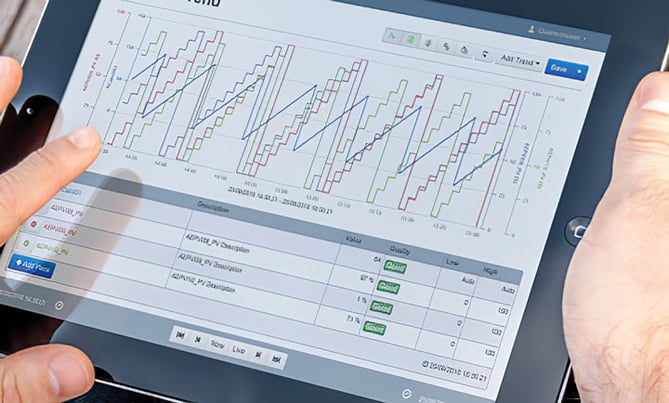 Figure 3. Historian data can be accessed from tablet computers.
Alarm management at a gas field
In Europe, a large facility extracting gas from dozens of widely dispersed well heads and tank farms is fully automated. Each well head or tank farm is linked to a central control and monitoring center to form one of the largest distributed control systems in the world.
The facility, with more than 750,000 potential alarms, requires an alarm management solution for safe, effective, and efficient operation. The alarm management system has to be used by all plant personnel, including operators, engineers, and managers. Alarm reporting and analysis is used to help identify and eliminate faulty and incorrectly configured alarms, reducing the number of alarms presented to an operator.
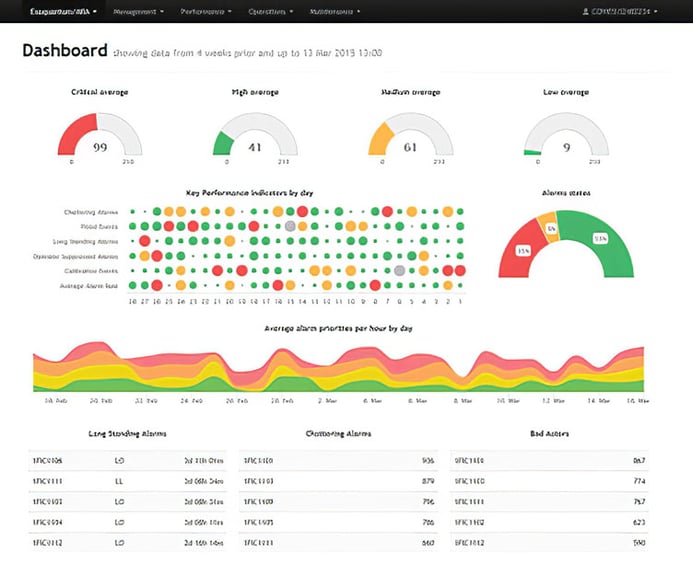 Figure 4. An alarm reporting and analysis dashboard is used in a European gas field to summarize activity on 750,000 possible alarms.
The well heads and tank farms are linked to the central monitoring and control center via seven Web servers. A process historian monitors the 750,000 potential alarms, analyzes how operators respond, and produces reports (figure 4) at the end of each shift to show:
- standing alarms at the end of a shift
- top 10 alarms by number of occurrences during the shift
- alarms suppressed by an operator at the end of the shift
- alarms in calibration at the end of the shift
- mean alarm rate for the shift
- alarm rate distribution by the clock hour
Weekly and monthly summary reports are available for management and planning meetings. The alarm management solution follows EEMUA 191 and ANSI/ISA-18.2 guidelines.
Valve travel times
At a large oil production facility, reports on high-integrity pressure protection system (HIPPS) activations were being generated with a custom application package running on a legacy DCS, which needed to be replaced. The company wanted a standardized solution independent from the DCS, so that it could be implemented across many locations with minimal configuration at each site.
The DCS-independent historian solution receives sequence of events (SOE) data from the HIPPS to generate HIPPS activations and event travel time reports. This solution has been deployed at two sites so far, each with a different DCS. At one site, the SOE data is collected through an OPC server connected directly to the historian. At the other site, SOE data is collected through the remote data synchronization application that provides a robust communication method to address low bandwidth and intermittent network connections.
All HIPPS activation and configuration data is stored in the process historian, with additional tables used to store intermediary report data. Reports at both sites are created with Microsoft Reporting Services. The reports are also available in PDF format to facilitate review and distribution among multiple teams.
Analyzing alarms, events, and PID control data
An agribusiness group wanted to analyze alarms and proportional, integral, derivative (PID) controller performance for 10 of its production plants worldwide from a cloud-hosted centralized control center. It needed to analyze alarm performance and improve the operation of its PID controllers from its headquarters and continue to access plant information locally. The 10 plants had control systems from five different vendors. A historian was deployed in a cloud-hosted environment (figure 5) to provide the required solution.
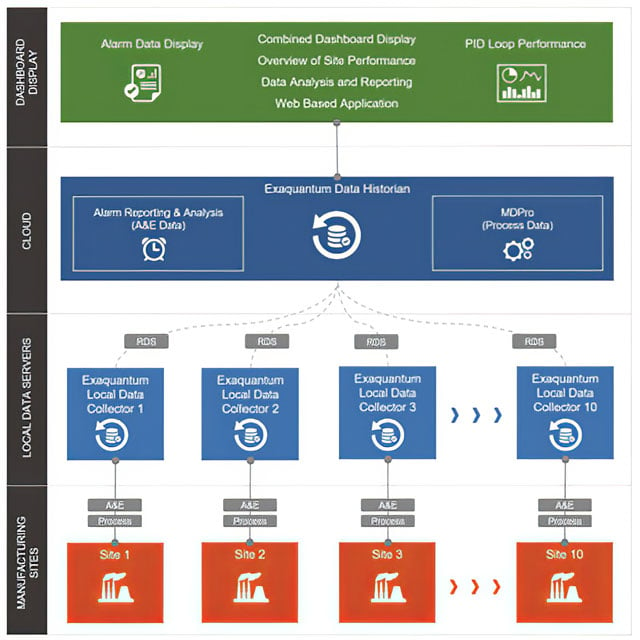 Figure 5. This cloud-based historian acquires data from five different types of control systems in 10 plants worldwide, and produces alarms and events and PID controller performance reports.
Data from all plants is consolidated in a single cloud-based historian via a secure and reliable data transfer method. For alarm and events data, the historian collects process data and alarms and events from each plant's control system. The solution enables alarms and events to be collected and monitored for each plant, and includes report generation and key performance indicator (KPI) data for further analysis from the centralized control center.
PID loop performance and alarms and events are displayed in a combined Web-based dashboard, providing a single display of key data for each site. The global plant management team now has a complete overview of each plant's status, and can analyze performance and identify operational improvement opportunities.
Analyzing plant data across multiple sites lets organizations benchmark processes and equipment using real plant data for comparison and assessment. Additionally, this information helps establish best practice processes, which are applied across all sites to help identify and set attainable targets and evaluate overall performance.
Measuring safety systems
An ultra-deep-water production platform needed to monitor and record all safety KPIs and to record safety and performance information. It needed a repository for all trips and operational statistics, covering all safety instrumented systems, to measure actual performance against the original safety design.
The historian, located offshore, acquires data from the platform's DCS, safety instrumented systems, emergency shutdown systems, and fire and gas systems. The historian stores all relevant safety-related data. All essential safety-related KPIs and statistics are validated and available in a single location. Without this solution, it would be very difficult and time consuming to consolidate, view, and analyze this data.
Safety systems need to have proof tests at various intervals to demonstrate that each component or subsystem is operational, such as a valve activation. The system can show that actual activations were successful and can be used to verify that the safety system is working correctly while it is operating-eliminating the need for further proof tests requiring shutdown. This reduces the number of plant startups and shutdowns required for scheduled testing.
This proof testing and safety trip data provides design input for layer of protection analysis (LOPA) and safety case updates, showing the true demand rates and helping identify scenarios and the frequencies of events. For each safety loop, statistical data and reports illustrate the true demand placed on that loop over a number of years. This historical data has actual field demand rates, and can be used to validate the safety case against the original design assumptions that were based on calculations.
More value
Traditional historians were proprietary, closed systems used primarily to view and visually analyze process performance at a single site. Modern historians are open systems that work with any DCS or other data source, store data in open SQL Server databases and across the world in the cloud, and make data available to anyone, anywhere-as long as they have the proper security credentials.
Modern historians can also perform a variety of functions, such as alarm analysis, safety system verification, PID analysis, and energy monitoring. And instead of requiring companies to develop their own analysis software or hire data scientists, modern historians can be provided with or linked to specialized analysis application software.
A version of this article also was published at InTech magazine.