Low-Latency Analysis
One of the promises of Industry 4.0 (I4.0) is the ability to connect everything and anything in real-time and to automate many lower level or repetitive tasks. This allows data to move from the smallest sensor to the highest point in the organization with the only delay being the latency of the network. Reports that were once static snapshots of an organization are now dynamic data streams that ebb and flow with the minute-by-minute changes in the company. While much of the focus of I4.0 has been on the industrial side of the operation, the changes of this new revolution are merely a part of the overall digital transformation movement affecting all parts of the business.
Two primary calculations that are used in organizations are the overall equipment effectiveness (OEE) and the profit equation. While these equations can provide a general overview of the organization that can help to guide the deployment of resources, they can also be difficult to define and accurately measure. Further, since each equation is seen as only being relevant to its own part of the organization, OEE in manufacturing and the profit equation in finance, the usefulness of the two outside of their respective areas can be questioned. However, with this new ability to gather, process, and distribute data, this previously secluded manufacturing key performance indicator (KPI) can now be integrated into the profit equation. This allows for more accurate forecasting with OEE, and a better understanding of the financial impacts of manufacturing efficiencies.
OEE
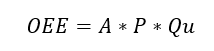
The OEE calculation is the combination of three metrics: availability (A), performance (P), and quality (typically Q, but Qu in this example). Availability refers to how often the equipment is available when it is required. Performance looks at the rate of production of the equipment relative to its designed rate of production. Finally, quality looks at how many quality parts the equipment produces compared to overall parts produced. Each of these metrics are expressed as a percentage, which allows the OEE number to also be expressed as a percentage.
The overall equation is then:
 The standard OEE equation provides equal weighting to each component, though organizations may want to provide different weighting depending on their individual situation. This customized equation will deviate from the standard equation, but it could be more useful to the organization in that form. The OEE equation is best used to establish a trend or a baseline within the organization. As a standalone KPI, it does not have much meaning, and cannot be easily compared to different types of equipment.
This equation will typically be used as a monitoring KPI, and while it can provide some information as to potential issues, root cause analysis will be required to pinpoint issues. In addition to the high-level nature of the KPI, it can be difficult to standardize on the metrics of the individual components. For instance, there are several different ways to determine downtime or what a quality issue is. Ensuring standards are implemented can help, but caution will need to be taken when comparing one piece of equipment to another.
Profit Equation
Much like the OEE equation, the profit equation is extremely general, and while it does provide a good summary of a range of inputs, getting useable information will typically involve running a root cause analysis.
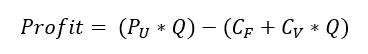
The profit equation looks at the price per unit, fixed and variable costs, and factoring in the number of units sold:
 Or to shorten it up a bit:
 This can be used to determine the viability of a business case: Calculate the minimum quantity that needs to be sold, the minimum price required to meet a certain target, or other basic commercial-related metrics.
Combining Process and Profit
While OEE and the profit equation might seem different, they go hand-in-hand. The manufacturing team must pay attention to OEE to be successful and the finance team must pay attention to the profit equation to be successful.
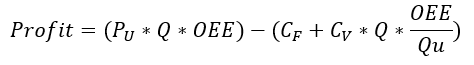
What about combining the two? Since OEE is a manufacturing metric, and the profit equation incorporates quantity produced, the quantity aspect of the profit equation would be a good place to put the OEE metric.
From a revenue perspective, all three components of OEE would have an impact on the quantity of revenue-generating goods, since a piece that couldn’t be produced due to the machine not being available or lower throughput levels would not be available for sale. Further, assuming all issues are caught and there is a general awareness within the business, a piece that does not meet the quality standard would not be sold.
This is similar to the cost portion of the profit equation, except for the fact that a poor-quality piece would still have been produced, thus incurring a variable cost in material and labor. Will the rework costs be as high as producing from scratch? It is possible and, unfortunately, this is the limitation of the high-level nature of the equation.
With this in mind, the new profit equation becomes:
 Since the total OEE value will always be less than the OEE value without the quality metric, any change in OEE (unless Qu=1) will have a higher impact on revenue than it will on costs. There will be less product to sell, and revenue will not be able to offset the costs due to poor quality.
Impact
Limited or not and accurate or not, this new equation easily identifies how important maintaining a high level of productivity and quality is to the profitability of the business. This is especially true regarding quality, due to its asymmetrical nature within the profit equation.
An example of this can be a company with the following metrics: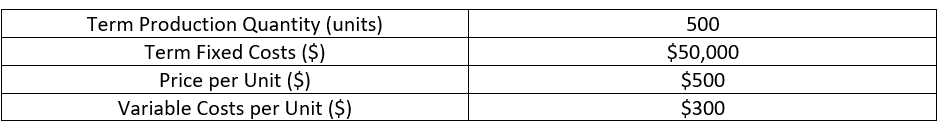 Based on an OEE, where all three variables are equal and equally weighted, the following profitability curve can be calculated:
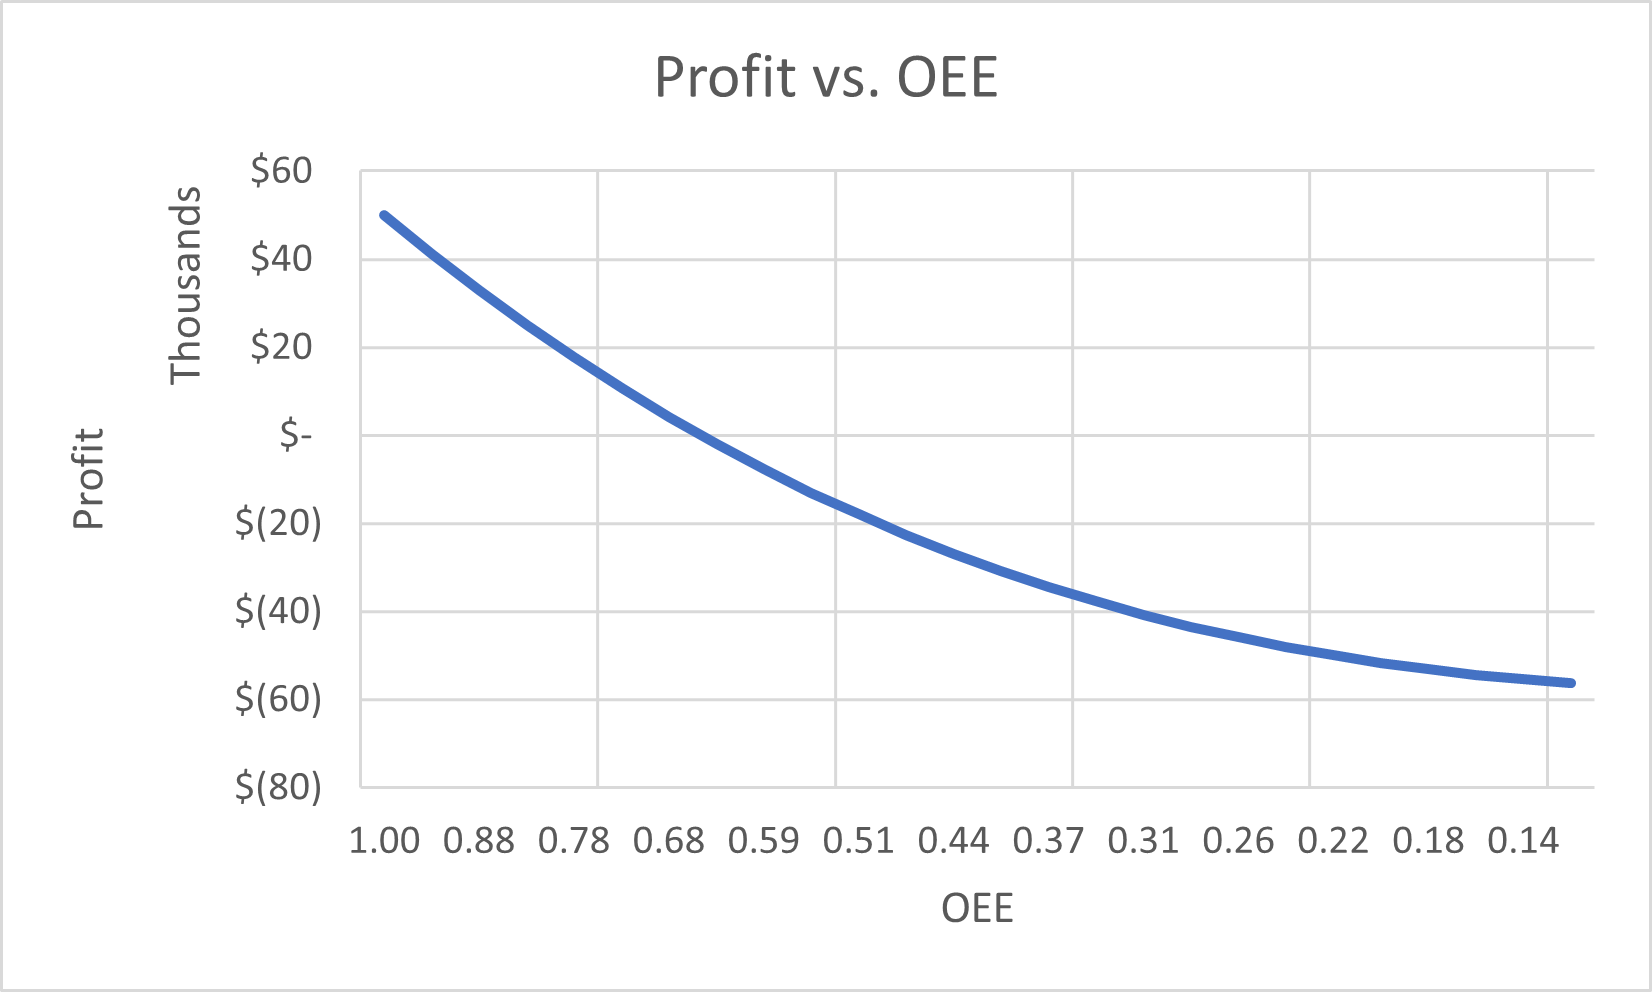 Provided everything is working perfectly, the business sees a profit of $50,000/term, or a profit margin of 20%. A reduction in OEE to 85% drops the profit level to about $27,800 and a profit margin of 13%. Breakeven occurs around the 65% mark, after which the business begins to see a loss.
Even a single point of change of the OEE metric can have a significant change in the profitability of the business. This will change depending on the nature of the business. Companies that see more of their costs attributed to fixed costs will be more impacted by any OEE change due to the loss in revenue. Companies whose costs are more variable will be less affected by the metric thanks to the partial offsetting reduction in production costs.
In addition to being used as a general guide about how manufacturing can affect revenue, this combination of KPIs can also help manufacturers determine how much an improvement in overall OEE or any of its components would be worth to the bottom line of the company. Using this combined equation, companies can look at what impact a potential program would need to have to make a positive revenue impact.
Conclusion
OEE is an important KPI for manufacturing facilities. It allows managers to baseline and track the health of their equipment to ensure that they are getting an appropriate level of production. On the commercial side of the business, the profit equation provides an equally important measurement that allows finance to ensure that their operations are operating in a manner that will allow for long-term stability. The combination of these two metrics, plus the addition of I4.0, allows for the more static financial figures to be combined with the now real-time metrics coming from production.
Knowing how OEE will impact the bottom line will allow companies to better allocate resources to the manufacturing area to ensure that availability, performance, and quality are maintained at a high enough level to ensure the profitability of the business.