This guest blog post was written by Edward J. Farmer, PE, industrial process expert and author of the ISA book Detecting Leaks in Pipelines.
Back in 1944 Erwin Schrödinger, the progenitor of quantum physics, observed in his essay “On Life” that a very many things are “true” according to the rule of the √n. In a random sample of 100 individuals, for example, perhaps √100 = 10 will not conform to a seemingly universal hypothesis, thus making it true 90 percent of the time. If the sample size is increased to a million then √n = 1000, so the hypothesis will then be found to be true 99.9 percent of the time.
The most profound implications on the other side are found when the sample size becomes small. If the hypothesis is tested in a room of 10 randomly selected people, it may be found that three of them (33 percent) do not conform. When it is applied to any randomly selected individual, quickly notice √1 = 1 meaning our entire sample is likely non-conforming.
This simple observation has everything to do with the validity of rules one might propose on any subject, but particularly were human behavior is involved. It is easy for opposition to attack any proposed rule or theorem with as simple a basis as, “Well it doesn’t apply to ME,” thus implying that a rule should be “true all the time” in order to be called a rule and thereby relegating it to the realm of anecdotal observations.
In fact, where people are concerned no rule applies to every one of them, although there are a number of rules that are true even in broad context. In classical mathematics a “proof” must be absolutely true and comprehensive. In modern science (e.g., quantum physics) many outcomes involve probability and limits on certainty.
Einstein didn’t like the probabilistic aspects of quantum theory. He had a penchant for “true all the time” implications flowing from a minimum number of profound rules, so those who set the bar for efficacy of a rule at that high level are in good company. Unfortunately, very little progress will be made in any field involving people on that basis. Einstein is often characterized as not believing in a “dice-throwing God.” When I studied modern physics, I took that to suggest our quest should be toward explanations supporting universally predictable and repeatable outcomes – that true-and-complete understanding took us through a stochastic “curtain.”
In statistics, we characterize probability experience by evaluating the probability density of a variety of observed or expected outcomes. When my son was seven he found he often won a dice-tossing event by betting the two-die result would add up to his age. He’s now 11 and is far less confident that using his age is a sure-fire way to be the most prolific winner.
Depending on the number of throws and the exact nature of the exercise it is common to characterize an expected result by its distance from the average of all of them. This is quantified by the “standard deviation” of a data set. It’s calculated as the square root of the sum of the squares of the differences between each of the data points and the population mean. Simply:
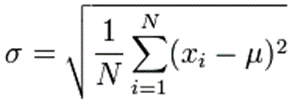
Where:
- σ is the standard deviation
- N is the number of data points
- Xi is the value of the ith sample
- μ is the population mean
In a “normal” data set this usually results in observing 68.27 percent of the observations are within a standard deviation of the mean (average). That’s about 2/3 of them. That leaves the rest lying above or below this central “consensus.” This concept is where stochastic concepts begin creeping into measurement (observation) issues, such as “accuracy.” It also portends the “confidence” we can have in the next measurement, or the one after that, or the one.
What is our confidence in an analysis for which we have measurements? Put another way, how sure are we of the accuracy of a particular measurement? As previously discussed, if we have but one measurement in our set it might be “right” or it might be “wrong.” If we have enough data to characterize a probability density function from our measurement experience, we can look at the expected variations and the value of a particular measurement.
One standard deviation contains 68.27 percent of the data, two contain 95.45 percent, three contain 99.73 percent. Any situation can be calculated but the purpose here is just to develop a feeling for the concept. Note that this discussion is focused on “normal” (also known as Gaussian) distributions. A process may turn out to have a different distribution shape, but that’s a subject for another day.
In many automation applications the process can change faster than the measurement system can report values. The number of readings available over what may be a short period of interest can have a profound effect on the confidence one might have from an analysis. When it comes to data, more is usually better which hopefully this excursion into statistics has demonstrated.
Read all the blogs in this pipeline leak detection series!
How to Optimize Pipeline Leak Detection: Focus on Design, Equipment and Insightful Operating Practices
What You Can Learn About Pipeline Leaks From Government Statistics
Is Theft the New Frontier for Process Control Equipment?
What Is the Impact of Theft, Accidents, and Natural Losses From Pipelines?
Can Risk Analysis Really Be Reduced to a Simple Procedure?
Do Government Pipeline Regulations Improve Safety?
What Are the Performance Measures for Pipeline Leak Detection?
What Observations Improve Specificity in Pipeline Leak Detection?
Three Decades of Life with Pipeline Leak Detection
How to Test and Validate a Pipeline Leak Detection System
Does Instrument Placement Matter in Dynamic Process Control?
Condition-Dependent Conundrum: How to Obtain Accurate Measurement in the Process Industries