

This post was written by Robert Allen, VP of operations at Lin and Associates.
Editor’s Note: ANSI/ISA-18.2-2009, Management of Alarm Systems for the Process Industries and ISA-101, Human-Machine Interfaces are valuable standards for users designing Level 1 displays. Click this link to go to the ISA Standards website page.
Level 1 display design cannot be a one-size-fits-all approach. What may work for operators at one company may not work for others somewhere else. The challenge is to find the balance that gives the operators a display that meets the goal of their facility’s level 1 scope and, simply put, that just makes sense.
To review high-performance graphics hierarchies, most human-machine interfaces (HMIs) today are designed by exposing an increasing level of detail as you navigate or drill down into the plant’s units, subunits, and details. For example, an operator may be responsible for operating multiple process units with the HMI providing a process unit level overview (level 2 graphics) for each of those units. As the operator navigates to a level 2, drilling down to a specific tower or heater displays control-type graphics. These are piping and instrumentation diagram–style graphics with instrumentation and controls designed as a system and based on the operator’s mental model of the process. These types of displays are called level 3 graphics. If there is ancillary equipment or systems (compressors, pumps, heater internals, safety instrumented systems, etc.) related to a level 3 graphic, this instrumentation is on a detail graphic (level 4 graphic) with navigation provided to and from the associated level 3 graphic. Operators can make control changes from all three levels of graphics; the hierarchy just exposes varying levels of detail so that they can detect, diagnose, and address potential issues as they drill down.
Even with modern distributed control system (DCS) consoles that accommodate six to eight screens per operator, this level 2, 3, and 4 hierarchy can lead to a phenomenon the industry refers to as the “keyhole” or “tunneling” effect. This happens when operators are so focused on the diagnoses and correction, or adjustment, in one process unit in their scope of responsibility that they potentially miss early detection of an issue within another section. Level 1 displays can assist with this problem.
If you walked into a control room 20 years ago, you would likely see a wall with an arrangement of single loop controllers, strip chart recorders, circular charts, and so forth, grouped together by function or process. Operators monitored the values reported by the panel instruments, essentially “seeing” their entire scope of responsibility. Without walking to the instruments, operators could not see the actual quantitative value, but they learned to recognize where a certain value should be during normal operation—by memorizing that the trend pen should be in the middle of the chart, for example. It is human nature not to exert effort unless needed, so the operators became very efficient at monitoring and recognizing these patterns of normalcy—and only exerted effort if normalcy was disrupted.
Today, there is a push in the refining industry to move operators to centralized control rooms (some have been doing this for a while), mainly as a result of incidents throughout the process industries. With the input and recommendations of human-factors experts, such as Ian Nimmo of User Centered Design Services, the designs of these centralized control rooms are resulting in spaces with large-screen video wall technology. Notice the word “wall,” essentially harkening back to the pattern-recognition methods of the 1970s and ‘80s. The key is to identify the appropriate information to be displayed on this wall. We could simply place a large version of that process flow diagram–style graphic. The quantitative values on the wall would solve the valuable real-estate issue. However, the real answer is displaying information so that operators know at a glance if their process is within normalcy. Companies can accomplish this with techniques that take us back to the old-school control room—back to using the operators’ abilities to recognize patterns of qualitative data. There have been numerous studies regarding the human brain and its ability to quickly identify patterns, and more importantly, to recognize when the pattern is in disarray. By correctly utilizing today’s technology and lessons learned from the past, an interface can be designed that enables the operator to increase safety, plant reliability, and profitability through reduced upsets, variability, and improved situational awareness.
Detection, diagnosis, and action were discussed earlier with the intent of level 1 displays zeroing in on the detection portion. The best method for determining the points, or tags, that give early detection is to conduct a task analysis. The task analysis team should consist of a very experienced board operator, a new board operator, and the HMI designer/engineer or HMI consultant. The reason for including both an experienced board operator and a new one is to obtain the perspective of each; in many cases, what is second nature to one is foreign to another. To facilitate a task analysis, there are proven methodologies available, such as Critical Action and Decision Evaluation Technique (CADET). I have found success with a variation or hybrid of the CADET approach combined with certain elements of the Rasmussen model. This tactic allows the company to concentrate on identifying data that gives the operator an early detection (before an alarm condition) of a potential problem. The main reason for this approach is that in many cases alarm systems are not indicative of early detection and are currently only promoting reactive operations. This is not true in all cases, but common where sites have not recently conducted a successful alarm rationalization.
Once the task analysis is complete and all the early detection points have been identified, the task of creating a level 1 graphic layout design begins. The first question is where the level 1 monitor or display system will reside. Specifically, how will the control room accommodate the level 1 display system? It could be a video wall, large monitors affixed to a wall behind the console, or monitors hanging from the ceiling or integrated into the operating console. Each option, and the operating console arrangement within the control room, has an impact on the level 1 graphics design. Although many of these options are constrained by the space allotted in the control room, there are also several factors that are beneficial to recognize before making a decision.
With the video wall, the main concern should be viewing distances between the operator console and the physical video wall. In this setup, operators will not typically make adjustments on these displays. With a text or numeric value size recommendation of 1 inch of height per 10 feet of distance from the wall, it will be difficult to use much text or many numeric values, especially when they may need to be 1–3 inches in size just to be readable. So in this case, the design should include a process depiction with enough context for the operator to easily recognize the layout of the process units. Use qualitative objects, rather than numeric values. These objects should also be an obvious indication to detect abnormal situations early. For instance, trends, providing the pens or traces, are very visible, especially when combined with other pattern-recognition type objects.
With video wall systems, adjacent console operators can view and monitor the level 1 graphic, allowing them to prepare and preemptively avert an issue caused by an abnormal condition feeding in from another unit. I have had some success when the design of video wall level 1 displays are too abstract, where little or no process context is utilized (a dashboard type). Furthermore, operator training and familiarity with the points used may take longer, because there is no interaction (e.g., clicking or mouse over to expose the tag name) with this type of display, but this approach does work for long viewing distances (figure 1).
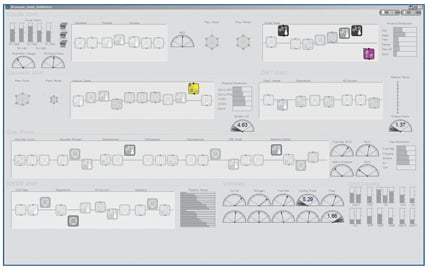 Figure 1. Abstract iconic screens are effective for long-distance viewing of wall level 1 displays. (Display created using ALTIUS High Performance HMI Solution from Lin & Associates.)
In regard to the remaining level 1 display system arrangements mentioned above, you can apply some of the same rationale regarding viewing distance rules and the use of text and numeric data. You will need to weigh the benefit of placing text and numeric data against the value of the real estate available. Depending on console proximity, and whether or not this type of display system will be driven at the operator station or at the video wall, operator interaction can be accommodated on this type of level 1 display. I still recommend a design with a process depiction that has enough context with the use of qualitative and pattern-recognition type objects.
Recently, I have found great success by designing the layout similar to a process flow diagram, without all of the interconnecting process lines, for units under the operator’s scope of responsibility (figure 2). These types of level 1 display systems also allow the operator to interact with the objects, exposing information such as tag names and descriptions, and toggling between qualitative and quantitative views to facilitate operator familiarity and acceptance. When using this type of display system, however, the benefits of console adjacency will be limited, especially if the display system is integrated into the operating console. The upside to this display system, though, is that the technology can provide improved resolution with 4K and ultrahigh definition.
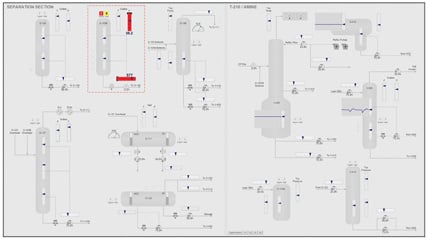 Figure 2. Process flow diagram displays can be very effective without interconnecting process lines. (Display created using ALTIUS High Performance HMI Solution from Lin & Associates.)
Finally, there has been consistent mention of including pattern-recognition type objects on level 1 overview displays, objects that promote operators’ abilities to quickly glance at displays and assess the health of their unit, but what about other forms of indication that can easily be included if space permits? In addition to early-detection indicators, some other ideas for level 1 content include key performance indicator targets, economic targets, environmental targets, personnel safety such as eye-wash station status, air monitoring status, and other plant-regulating indicators, such as boiler steam drum levels, plant effluent discharge limits, and live video streams.
In summary, when designing your level 1 displays, be mindful of the operating environment regarding control room layout. What is designed for an integrated level 1 display system may not work for a video wall and vice versa. You will need to ensure that there is an appropriate level of context to the plant layout, which will depend on the experience level of operations and whether the display will be used as a training reference. When selecting the data or information to be presented on level 1, be sure it gives the at-a-glance view of the health of the operator’s scope of responsibility. Lastly, be sure to include operations in the design process. These are tools for them to use to increase situational awareness, counteract the “keyhole” effect, and operate the facilities more efficiently.
About the Author Robert Allen is VP of operations at Lin and Associates, a control systems integration and consulting firm. He has extensive knowledge and more than 24 years of experience with process controls, system integration, HMI design, and best practices.
Connect with Robert:![]()
![]()
A version of this article also was published at InTech magazine.
