Recently, there has been renewed interest in monitoring manufacturing production efficiencies in real time. This has led to an interest in understanding more about overall equipment effectiveness (OEE) and the trending of cycle times. The International Society of Automation (ISA) recently published a book, “Manufacturing Execution Systems: An Operations Management Approach,” that discusses the issues of manual data collection and how to understand OEE and cycle timings in the wider scope of manufacturing operations management (MOM).

In the following excerpt from this book, we will look at a real-world example of calculating OEE.
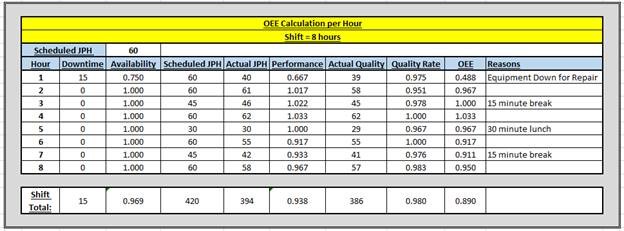
So let us start with OEE. OEE is calculated by:
OEE = (Equipment Availability) · (Production Performance) · (First Time Quality Rate) [i.e. First Time Quality FTQ]
In which:
Equipment Availability = (Scheduled Production Time) – (Equipment Down Time)
Scheduled Production Time
Production Performance = Actual Jobs per Hour
Target Jobs per Hour
(Note: could be Jobs per Shift, or Jobs per Day, etc.)
First Pass Quality Rate = Actual Good Product
Total Product Produced
(Note: "Good Product" refers to all product that is not scrapped or does not need to go into repair or rework—in other words, products that are acceptable from performing each operation only once, with no quality dispositions.)
So as an example:
 What must be understood is that the actual OEE number is for general information. In most manufacturing plants, there are separate teams that review each of the three metrics that make up OEE: the maintenance team looks at the equipment availability, the production team looks at the production performance, and the quality team looks at the first pass quality rate.
The production team needs to understand the metrics that are not part of scheduled production. For example, tolling changeover time is not part of production performance, because production cannot be scheduled for that time. This may skew the production performance metric. Cycle times are actually not part of OEE, but a separate metric.
To explain this further, we need to explore a real-world example. Using a five-station production line, it is determined that in order to support the production schedule, production must produce 60 units of a product per hour (also known as jobs per hour—JPH), which means a unit is coming off the line at a pace of one every minute. This means that the product can only stay in each station for 60 seconds, and this time must include time to complete the work required in each station and any reset or setup time to prep for the next cycle. Given this set of requirements, the following table is created for a specific cycle.
Table 6-1: Cycle Times Table Example
|
Station |
Work Time |
Prep Time |
Total Time |
Actual Work Time |
Actual Prep Time |
Actual Totals |
|
1 |
45 |
15 |
60 |
45 |
14 |
59 |
|
2 |
40 |
10 |
50 |
40 |
10 |
50 |
|
3 |
55 |
0 |
55 |
56 |
0 |
56 |
|
4 |
50 |
10 |
60 |
55 |
10 |
65 |
|
5 |
45 |
10 |
55 |
45 |
10 |
55 |
For each cycle, the actuals are monitored and trended. Cycle times at or under the expectation will show up green. While five seconds over cycle (which would show up red) for Station 4 does not sound like a lot, if this actual cycle time repeats itself, it does represent a production issue. If it is five seconds over cycle for each cycle, after 12 jobs the throughput will drop by 1 job (5 · 12 = 60). This will cause an inability to support the production schedule.
Such an event will require additional research, for the root cause may be equipment-related, or operator-related. Perhaps a new operator has taken over that station and he/she is taking five additional seconds to complete their task as the operator ramps up to speed. Or, the station could be overloaded with its work definition, in which case the industrial engineering team will need to come in to help to adjust the defined work.
Overall, the OEE and cycle time data needs to be organized in dashboards and reports in such a way that the proper personnel can properly respond.
To read a longer excerpt or to purchase this book from ISA Publishing, visit the ISA Store.