So, is “IT/OT convergence” just another gimmicky buzz term?
You could argue that it is. Whenever someone has caught onto a new idea, there is an attempt to make it memorable and to make it sound like “the best new thing since sliced bread.” So, of course, someone is going to come up with a catchy phrase that is supposed to inspire change, and that they can use for marketing.
The thing is, however, this “convergence” of IT and OT is really just the next extension of making data usable.
What Is IT/OT Convergence?
Some time ago, we saw the start of automation in manufacturing. Automated equipment was designed to perform a specific function that needed to be performed at a speed or power level that humans couldn’t achieve. But when the automated equipment failed, the controls engineer would need to get into the system to determine what went wrong. This required going into the registers of the PLC systems to look for clues of the failure. This was the start of operational technology (OT) data usage.
Having some data leading up to the point of failure was good for diagnostics—to see what happened beforehand. As a result, PLC systems started using historians to hold longer streams of data from sensors, heaters, and automation actuators—using large amounts of OT data.
By monitoring the OT data from historians, the SCADA functions could provide operators with some insight into how the equipment was operating. When a failure was imminent, SCADA functions would allow operators (or supervisors) a chance to take action before the failure occurred. This required the SCADA system to have access to the data from historians, and used proprietary communications like MODBUS or PROFIBUS to make that data available to operators via human-machine interfaces (HMIs). But the monitoring was exclusive to the performance of the equipment, further expanding the use of OT data.
Through observation of these data streams (gauges, operator screens, and so on) and through understanding more about the drift of data, one could recognize—via the SCADA systems—not only when failure of equipment was imminent, but that the data could also be used to analyze failures in product quality at test and inspection—operations that may have been several steps later in the process.
This created a need to have OT data linked with IT data. It resulted in the creation of complex interfaces from PLCs and SCADA to information technology (IT) systems like MES, allowing relational data of product failure to be linked to operational data of the equipment making the product. Some tried it direct to ERP as well (and are still trying), but ERP systems are not equipped to process and present that data fast enough and in enough detail in relation to other events during the process of manufacturing.
The issue with the interfaces to MES is that they are highly customized and expensive, sometimes adding as much as 40-50% of the implementation cost for a project. The next step in the improvement in data access would be to make PLC data more accessible to MES and other relational databases. When this need for access is combined with the cost of computing and computer memory becoming cheaper and network communication becoming more stable (enter 5G networks), it made sense to connect the PLC sensors and actuators direct to IT networks (what we call IIoT) and make their data available to...whoever needed it.
All of this background is to highlight that making OT data more readily available to IT systems is simply the next step in a longer process of the technology evolution that brought us to Industry 4.0.
How Can IT/OT Convergence Be Used?
The interfacing of OT data to IT systems now encountered a new problem.
The PLC/SCADA systems that monitor sensors in historians can create large streams of data (up to megabytes in size) within seconds. From the perspective of understanding the characterization of an event back to the IT systems, however, this stream of data—even in small timeframes—is simply too much for the relational databases of IT systems like MES to handle. Many implementations have tried to record an instance of sensor data (taken from a stream of data) to capture a single data element, to attempt some representation of OT events at the IT level. Many have found, however, that linking an instance of OT data to a quality event of a product during manufacturing is not very effective for monitoring the quality of a process in general.
We now need to determine ways to aggregate streams of data from OT systems in a manner that holds onto the important characteristics of a production event. The reporting of OEE is one of these attempts at aggregation. It is important to recognize that when using any form of data aggregation, there is going to be some loss of the important details of a quality event. That is why OEE is used as a monitoring-level data object and not an analysis-level object. However, by monitoring the real-time value of OEE changing, an IT system can recognize the rate and magnitude of the changes and create an alarm to alert to a problem.
To analyze that actual problem, you will need to go back to the original data stream that was used to create the OEE value. At least with the OEE value being provided in real time, manufacturing and controls engineers gain visibility into an issue early enough so that they can go back to the historian for analysis before the event is buried by more data from the OT data stream.
The issue is, how do you aggregate the data?
The answer, as always, is...it depends!
How to aggregate the data will depend on what data you are aggregating and what you are trying to monitor within the process. It will also depend on being able to interpret changes in the data aggregation model.
In this section, I will look at one such aggregation method and present some of the ways to interpret changes in this data set.
The “natural distribution curve” or histogram is one of the most common graphic representations of data from devices like sensors. The primary premise of the curve is that, if there is only normal random variation in a process, the distribution of the instances of data will fall into a pattern resembling a natural distribution curve.
Figure 1 depicts what the distribution of readings from an oven sensor might look like with normal variation when plotted in a histogram.
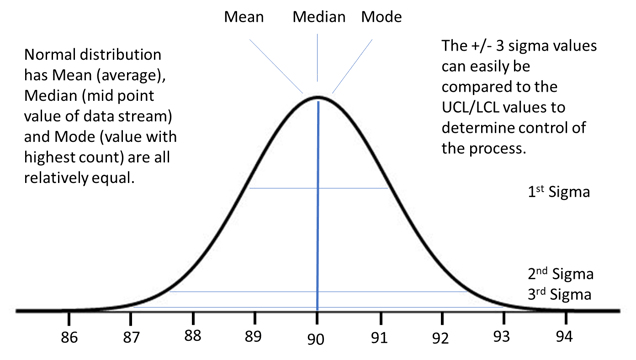
Figure 1: Distribution curve of oven temperature showing mean, median, and mode. Courtesy of the author.
The key characteristics of the curve is that the mean (average), median (middle value of the data stream), and the mode (value with the most occurrences) are all approximately equal. This can be used as a reference to determine if the process is experiencing problems. As long as there is an indication that the process is in control, there is value in determining the +/-3 sigma values and comparing them to the upper and lower control limits and the product specification limits.
An Example Scenario
To monitor the process of a production unit going through a curing oven, the MES system would take note of the time the unit entered and exited the oven. During this time, the PLC system (using a smart sensor) would create a constant stream of temperature sensor data that would be stored in a local historian database in the sensing device. When the production unit exited the oven, the MES would make a request to the device for an aggregate of the temperature data during that defined time period. Even with limited computing power available at the device level, the device could take hundreds (or even thousands) of data points and provide a set of aggregated data back to the MES—instead of providing a single instance of the sensor data, as is typical, or trying to process the entire data stream.
The following would be a set of aggregated data values for this production unit:
- Mean: 90.0
- Median: would be very close to 90.0
- Mode: approximately 90.0 degrees as well
- +/- 3 Sigma distribution: 87.0, 93.0 (to be verified with UCL and LCL)
By doing a quick analysis of the differences between the mean, median, and the mode, the MES can look for acceptable process control monitoring as well as trending changes from previous production units that have already passed through the oven. If the +/- 3 sigma values are beyond acceptable limits, the MES would automatically flag the production unit as suspect, likewise if the mean, median, or mode significantly differed from one another or from previous products.
Figure 2 presents an example of how these same values would indicate a process that was not in control. In this case, however, it is still possible that the +/- 3 sigma values could be within limits.
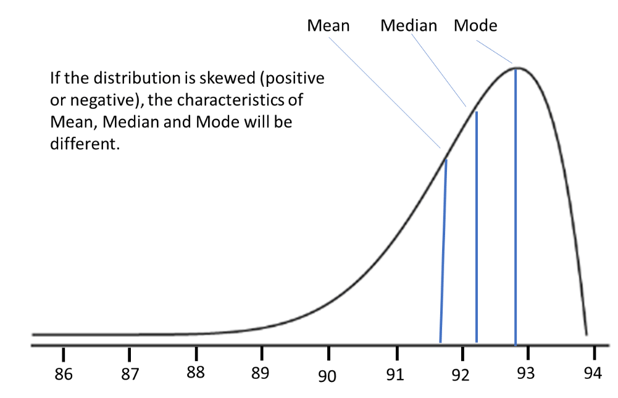
Figure 2: Example differences of mean, median, and mode in a skewed process. Courtesy of the author.
Now, technically, if the distribution is skewed as shown, the +/- 3 sigma values may not be considered valid as a result of the skewed nature of the data set. But the immediate analysis by the device can still be used to determine if the control limits have been violated.
The key point: if this is the kind of data set being provided by a smart sensor, it is an indication to manufacturing engineering that the oven is not operating with only random variance—and therefore should be investigated.
Other differences in mean, median, and mode (e.g., the mean and median are equal, but the mode is different) can also indicate conditions like a bi-modal distribution that suggest multiple process influences at play. Once again, manufacturing engineering should look into the process.
When the above data sets are linked direct to the production unit at the MES level, this data can be used—with test and inspection results—to indicate if there is a link between variation in oven temperature and the failure of the production unit.
Whether the product failed as a result of the process issues or not, seeing data values drift during a production run can also indicate fundamental process management issues that need to be investigated.
Summary
The previous examples of data aggregation only reflect a specific scenario, but they are meant to provide a view into the reasons for the convergence of OT and IT data as well as the potential value of this convergence. In each production scenario, the correct method of data aggregation would need to be evaluated, and the programming of smart devices would need to make this functionality available. Or, as an alternative, edge computing systems would be programmed to replace the functionality described for the smart devices.
The bottom line is that, although the industry heavily uses “IT/OT convergence” as a buzz term to describe changing technology, there is a legitimate change in data processing that the technology behind the buzz term delivers. Companies who take advantage of the technology of convergence, and who learn to properly aggregate and interpret data presented via convergence, can gain practical advantages in the effectiveness of quality and facility management programs. In today’s competitive global environment, using any advantage is good for the bottom line.
So, the answer is no. IT/OT convergence is not just a buzz term. It is a valuable tool in the evolution of data acquisition and management technology that can greatly benefit manufacturing companies. Learning how to aggregate the data from the OT level so that systems at the IT level can deal with it is an important part of the convergence.
Interested in reading more articles like this? Subscribe to ISA Interchange and receive weekly emails with links to our latest interviews, news, thought leadership, tips, and more from the automation industry.