This guest post was written by Greg McMillan, industry consultant, author of numerous process control books, 2010 ISA Life Achievement Award recipient and retired Senior Fellow from Solutia Inc. (now Eastman Chemical).
The three types of process responses encountered in industry are defined based on an open loop test where the PID is in manual or remote output so there is no response of the PID to the process (no closed loop response). A step change is made in the controller output. The process response is observed until the process can be identified. During the test, there should be no disturbances so that the process response seen is entirely the result of the step change in PID output.
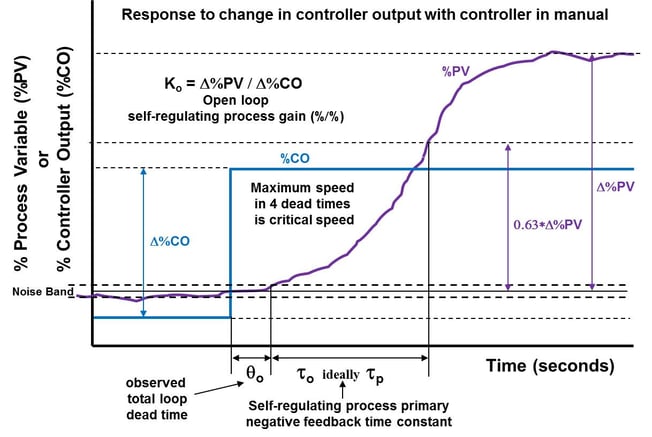
The three types of processes are self-regulating, integrating, and runaway. A self-regulating process will decelerate to a new steady state operating point (see the figure) due to negative feedback within the process. An integrating process will continually ramp from the lack of feedback within the process. A runaway process will accelerate until hitting a relief or interlock setting due to positive feedback within the process. As the degree of negative feedback within the process (degree of self-regulation) decreases, more negative feedback action is needed from the PID controller (more proportional action by a higher gain setting). For estimating loop performance and tuning settings the parameters used to identify each type of response are gain, time constant and dead time. The definition of the parameters depends upon the type of response. The terms have alternate names in industry. For example, “lag” is used for time constant, “delay” is used for dead time, and “sensitivity” is used for gain.
Observed response
The response observed in these tests includes the response of the analog output, final control element (e.g., control valve or variable frequency drive), process, sensor, transmitter, analog input, and the process variable (PV) input to the PID. The observed response includes the effect of velocity limits, dead times, time constants, and gains in the automation system. Better terminology would be “open loop response” than “process response” because the observed response includes almost everything in the loop response. Also, the source of the individual parameters that create the particular dynamic in the response should precede the term (e.g., valve dead time and measurement dead time).
The best controller tuning settings can be determined by identifying key dynamic variables that characterize the process response. See the extensively updated Good Tuning: A Pocket Guide 4th Edition for concise guidance on this topic and everything else you need to know to get the most out of your PID controller.
All processes have a dead time that is the time interval between the step change in output and the first recognizable change in process. Noise can delay the recognition until the excursion is beyond the noise band creating a longer dead time. The observed dead time is frequently called the process dead time. The observed dead time is really a total loop dead time (θo) that is the sum of all the pure dead times and the equivalent dead times from all time constants smaller than the largest time constant in the loop for a first order (one time constant) plus dead time approximation. For a second order plus dead time approximation that includes a secondary time constant, all time constants smaller the largest time constants create an equivalent dead time. The secondary time constant creates the bend in the initial response right after the dead time. The equivalent dead time increases from 30% to 99% of the time constant as the ratio of the time constant to the largest time constant gets smaller. Time constants small compared to the largest time constants are summed as being essentially 100% dead time.
We will see in a future post on loop performance that ultimate limit to the peak and integrated errors are proportional to the dead time and dead time square, respectively. If there was no dead time and no noise, perfect control would be possible.
Additional delay
Not seen in these open loop responses is the additional delay experienced in closed loop operation from the time it takes for the output signal to pass through dead band (backlash), threshold sensitivity (stiction), and resolution limits of the final control element (e.g., control valve). The test uses a step change larger than these limits. In closed loop operation, a step change in output can occur for a step change in set point but subsequent closed loop action to recover from overshoot or disturbances involves gradual changes in the output. The additional dead time from these limits can be approximated as the limit divided by the rate of change of the signal (e.g., valve dead band divided by the rate of change of the PID output).
The open loop time constant (τo) is the largest time constant (i.e., primary time constant) plus any the portion of smaller time constants not taken as a secondary time constant or as effective dead time. While often called the process time constant, the largest time constant can occur anywhere in the loop. For liquid pressure and flow loops, the largest time constant is usually somewhere in the automation system (e.g., valve, sensor, transmitter, or DCS). Ideally, the largest time constant is the primary time constant of the process downstream of where the disturbances and manipulated flow enter the process. We will see in the section on loop performance, the effect of such a primary time constant is beneficial. The ultimate limit of the peak and integrated error is inversely proportional to this primary time constant. The primary process time constant slows down an excursion from a disturbance giving time for the PID to catch up with it. If the largest time constant is in the measurement, the trend chart oscillation may look better because the amplitude is attenuated by the filtering effect of the measurement time constant. In an open loop test, you cannot discern the location of the largest time constant.
The second largest time constant is called a secondary time constant (τs). The secondary time constant can be quite large due to heat transfer surface and thermowell lags in temperature processes and mixing or electrode lags in concentration or pH processes.
Control element, process and measurement gain
The open loop gain (Ko) is the product of the final control element, process, and measurement gain. Consider a loop with a control valve. The final control element gain (change in flow divided by the change in % PID output) is the slope of the valve’s installed characteristic curve. The process gain (change in process variable divided by the change in valve flow) is the slope of a plot of the process variable versus valve flow. The measurement gain (change in % PID input divided by the change in process variable) is the 100% divided by the measurement span.
Since the PID algorithm uses % signals, calculations of the open loop gain must involve % signals despite the fact that the PID block and graphics show the PID process variable and in some DCS the PID output in engineering units. Self-regulating processes are defined by a total loop dead time, an open loop time constant, and an open loop gain called a steady state gain (see the figure). A secondary time constant may be used to describe the initial lag (bend) in the response. The open loop gain is a steady state gain that is the % change in PID input from its initial to its final value divided by the % change in PID output giving a dimensionless gain. Liquid pressure and flow loops have a self-regulating response. Continuous composition, pH, and temperature loops have a self-regulating process response but the process time constant for large well mixed vessels is so large that in the time frame of interest for the PID (4 dead times), the response resembles the ramp of an integrating process. For tuning and analysis it is useful to treat self-regulating processes with a time constant much larger than the total loop dead time as “near integrating.” The next post will detail the dynamic response of integrating processes and runaway processes.
Choosing tuning rules
Determine the type of process response and choose the tuning rules accordingly. Make step changes to the process to identify the total dead time, open loop gain, and secondary time constant. If the process decelerates within the time frame of the major part of the PID response (four dead times after start of response), the process can be classified as self-regulating. For this process response, a primary time constant needs to also be identified and self-regulating process tuning rules are used taking care to use PID structures and tuning to minimize large abrupt changes in the controller output. In these processes, there may be no need to overdrive the PID output past its final resting value.

About the Author Gregory K. McMillan, CAP, is a retired Senior Fellow from Solutia/Monsanto where he worked in engineering technology on process control improvement. Greg was also an affiliate professor for Washington University in Saint Louis. Greg is an ISA Fellow and received the ISA Kermit Fischer Environmental Award for pH control in 1991, the Control magazine Engineer of the Year award for the process industry in 1994, was inducted into the Control magazine Process Automation Hall of Fame in 2001, was honored by InTech magazine in 2003 as one of the most influential innovators in automation, and received the ISA Life Achievement Award in 2010. Greg is the author of numerous books on process control, including Advances in Reactor Measurement and Control and Essentials of Modern Measurements and Final Elements in the Process Industry. Greg has been the monthly "Control Talk" columnist for Control magazine since 2002. Presently, Greg is a part time modeling and control consultant in Technology for Process Simulation for Emerson Automation Solutions specializing in the use of the virtual plant for exploring new opportunities. He spends most of his time writing, teaching and leading the ISA Mentor Program he founded in 2011.


