

This article was written by Mark Coughran, a senior process control consultant with Emerson. Mark has optimized the performance of control loops in 84 process plants around the world. His previous assignment with Emerson was to test the installed performance of many makes and models of control valves in the Fisher laboratory.
Plant engineers and technicians are frequently asked to tune the controller when a control loop’s process value has prolonged or significant excursions from the set point. But in many instances, no amount of adjustment of the proportional-integral-derivative (PID) parameters will make the loop behave as desired. When tuning fails, it is time to look outside the PID for a solution.
This article gives 10 real-world examples of problems external to the PID tuning. Each example starts with a plant diagram so you can understand the context. Although each example is from a particular process industry, there are similar problems and solutions in many different process industries—including yours!
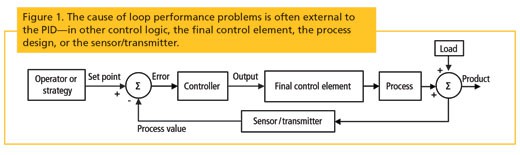
Figure 1 shows a typical process control feedback loop in block diagram format. An operator or a control strategy determines the set point (SP), which is compared to the process value (PV) in the controller to calculate the error. The controller then adjusts its output to the final control element to vary the process. The change in the process is detected by the sensor and transmitted as the PV to the controller.
PID loop tuning is covered in many articles and will not be the focus here. However, a proper loop tuning exercise—including measuring the process dynamics—should be the first step when approaching most loop performance problems. Many loop problems can be solved readily by tuning, and testing for the process response often reveals loop behavior that can help locate problems outside the controller.
Control valve response
Figure 2 shows three control loops on a fired heater. After the heater was retrofitted with NOX controls, the plant operators could not control the draft pressure PC-2 and asked the engineers to tune the controller. This loop uses pressure in the heater as the PV and sends an output to the final control element based on the difference between SP and PV.
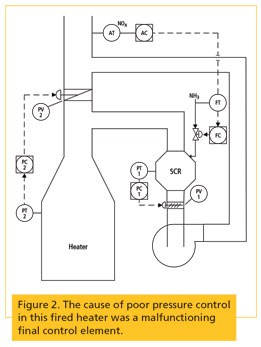
The main symptom of the PC-2 loop was that the PV could not reach SP for any value of output. A consultant worked with the plant operator to put the controller in manual mode and make steps on the output, but still saw no recognizable pattern of the PV responding to the output.
The consultant then asked the instrument technician for an inspection of the damper. After a sweaty climb up three ladders, they arrived at the damper, which turned out to be a very large butterfly valve—found in its fully open position. The consultant asked the operator, via radio, to put the controller in manual and step the output. Large output steps drove the actuator pressure—displayed on the local gauges—from zero to full supply and back again, showing correct response from the positioner. But the valve did not move, because it was jammed in the fully open position.
Repairing the control valve was required so it would respond to the positioner. The consultant also recommended bringing the HART position signal into the control system, so that diagnosis of control valve problems would be faster in the future.
Valve/actuator connection
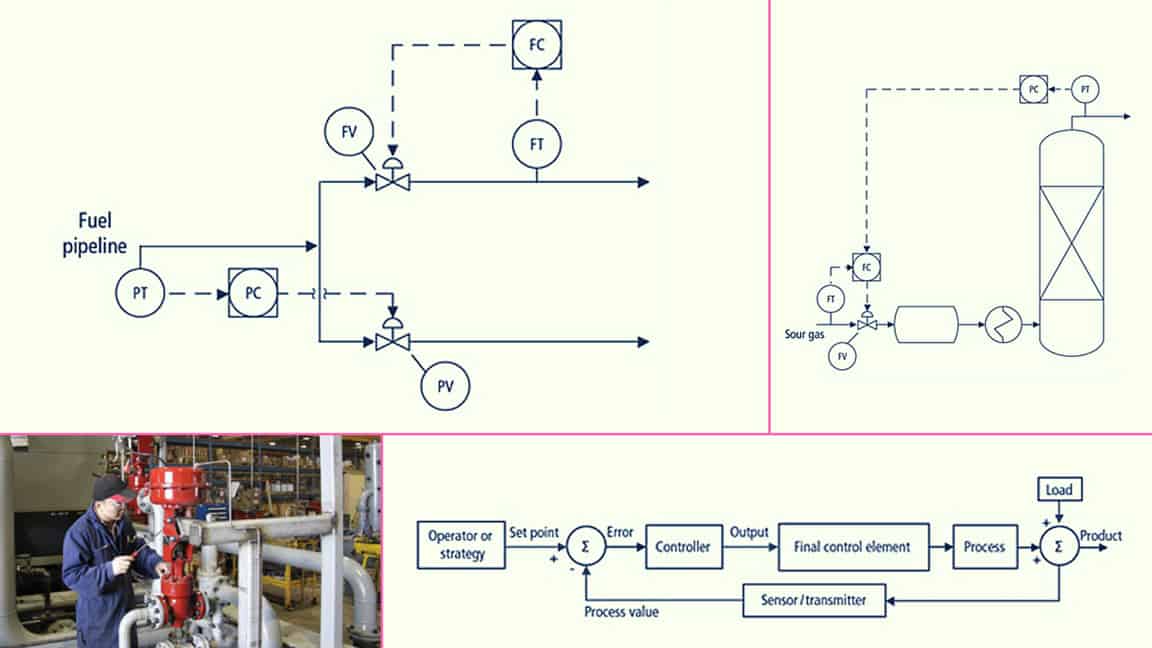
The new pipeline delivery station in figure 3 was experiencing large oscillations in pressure and flow, preventing the pipeline company from safely delivering fuel. The control loops used conventional 4–20 mA communications with analog valve positioners. Manual step tests showed erratic response of the pressure loop PV to its output, such that tuning of the controller could not be performed.
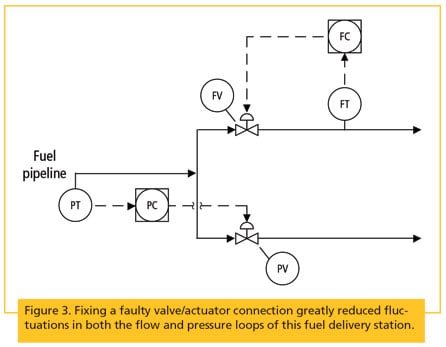
Suspecting a motion problem in the control valve, the consultant installed a position transmitter on the valve shaft. Test data confirmed the shaft position did not respond correctly to controller output. Close inspection showed the valve and actuator were supplied by different manufacturers and had been assembled with a slot-and-key coupling. This is appropriate for on-off valves, but zero backlash is needed for control valves. The consultant worked with a local machine shop to improve the coupling, so the station could meet its performance requirements.
Control valve flow characteristic and deadband
Several oil and gas extraction techniques require water or steam injection to free deposits from formations. A by-product of these techniques is produced water, which contains traces of hydrocarbons and other contaminants that require processing in a water treatment plant.
Figure 4 depicts the portion of the water treatment plant experiencing problems. The vessel treating the oily water had frequent high- and low-level alarms, and the overall reliability of the system was poor. The control strategy used a cascade control loop with the level controller LC as the master and the three flow controllers (FC-A, B, and C) as the slaves.
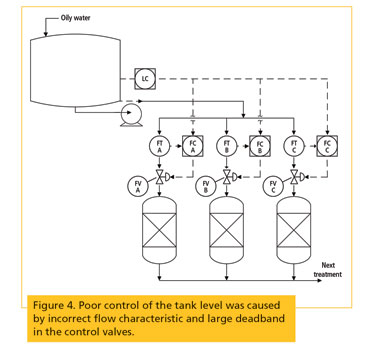
Tests conducted with the operators showed the flow loops responded very poorly to the LC output. Attempts to improve the tuning of the FCs were not successful. Further examination of test data from the FCs showed large deadband and extremely nonlinear installed flow characteristics, both caused by improper selection of the control valves. The consultant recommended specifications on deadband and installed gain to replace the control valves.
Valve positioner tuning
The cascade control system in figure 5 senses the overhead temperature of the steam regenerator, and the output from the temperature controller (TC) drives the two steam flow loops FC-A and FC-B. Each flow loop has a steam flow transmitter and a control valve. The overall symptom was poor control of the temperature PV, including a large cycle at steady state.
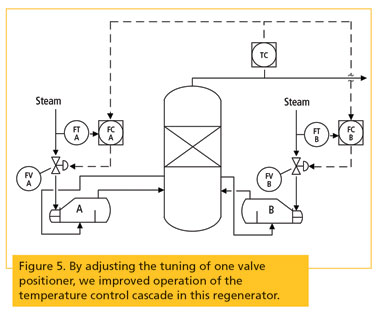
Tuning could not improve the TC loop, because the temperature PV responded poorly to the TC output. The consultant explored the poor temperature PV response along with the contribution of the flow loops to this condition. The FC-B loop showed a longer PV dead time than FC-A. Drilling down further, he found the control valve FV-B had a larger deadband than FV-A, although both were purchased with identical valve, actuator, and positioner hardware.
Using the asset management system, the consultant found low gain in the positioner tuning on FV-B and quickly corrected this. Both control valves then gave an acceptable response, and the FC responses were similar, allowing better tuning of the TC and reducing the cycle amplitude significantly.
Valve positioner assembly
Figure 6 depicts four reboilers of an absorber column in an acid gas removal unit. Each reboiler has a flow controller (FC-A, B, C, and D) to regulate steam flow. Each FC receives an SP from the absorber master temperature controller.
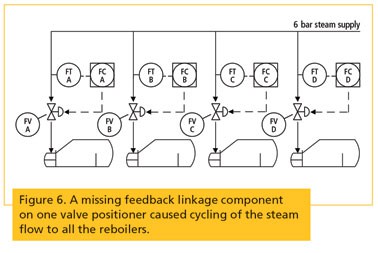
There were cycles on all four loops, with the largest cycle on FC-C. Testing FC-C uncovered an inconsistent relationship among the PV, the output, and the actuator position as indicated by the smart positioner read-back. Having learned all we could from the control room, we donned safety gear and went to the field.
Examining the control valves, we immediately discovered that FV-C was missing an important part in its feedback linkage. The maintenance department corrected this problem on the next shift, ending all complaints from operations regarding the reboilers.
Transmitter failure
Figure 7 pertains to a newly constructed crude fractionator in which the overhead vapors are condensed by the air cooler going into the reflux drum. Overhead pressure on both the column and drum is controlled by the vent pressure loop as shown. At startup, the operators could not control the column temperature and saw large excursions on the column pressure. They requested tuning of the controllers.
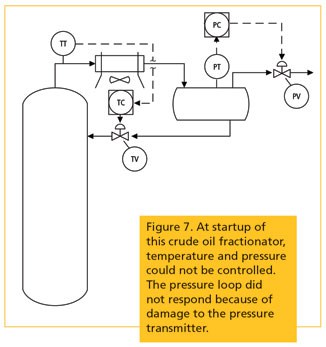
We attempted first to tune the pressure loop, but could not find any response of the pressure PV to small steps of controller output. Field observations, coordinated by radio with operator tests, confirmed the correct response of the pressure control valve. We gradually increased the step size to 20 percent, which disturbed the column level, but did not produce any systematic changes in the pressure PV.
At this point the most likely hypothesis to explain the data was that the pressure transmitter had been damaged during plant construction. We asked the Instrument Department to replace the pressure transmitter on the next shift. The PV immediately began responding to the output, and we proceeded to tune the pressure and temperature controllers for the desired response.
Signal communication
The extruder shown in figure 8 is one of two similar units (A and B) at a polymers plant. Each extruder has a control loop that senses the pressure in the extruder barrel and adjusts the speed of the gear pump accordingly.
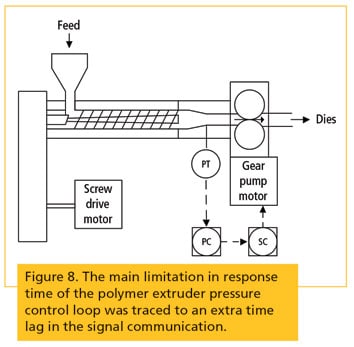
The extruder A pressure cascade responded as desired, but the seemingly identical extruder B pressure cascade reacted much more slowly. The gear pump speed control loop (SC as shown) responded quickly to its SP. Investigating the PC loop tuning, we found that the pressure PV of the B loop was moving much more slowly than the PV of the A loop, although both used the same kind of pressure transmitter with no added damping in the field.
We then examined the communication link from the transmitter to the controller. The plant had brought extruder B into their new fieldbus control system by landing the analog signals onto a multichannel Fieldbus temperature transmitter. The specifications for the latter transmitter revealed that it added a lag time constant of 5 seconds—appropriate for most temperature-sensing applications, but not for extruder pressure.
Extra filter in logic
Figure 9 depicts a reactor vent pressure control loop, with the valve position used to control overhead pressure on the reactors. When the loop was in the auto mode it cycled strongly. Similarly to the previous example, manual step tests of this loop showed a mysteriously slow response of the PV displayed by the PID controller.
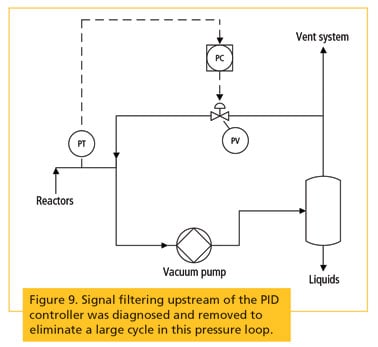
The PID block did not have any added filtering, but with a little more digging, we found a large filter in the analog input block upstream of the PID block. The signal coming into the analog input block showed a fast, linear process with negligible noise. After removing the filter, we were able to easily measure the process dynamics and apply lambda tuning in the controller. The result was a fast response to disturbances and no oscillations.
Low cutoff in logic
Part of a dehydration unit is shown in figure 10. The level controller LC senses the surge drum level and sends an SP to the flow controller FC. The flow controller senses the flow of liquid hydrocarbons from the sour oil drum and adjusts this flow with a control valve. A low level on the sour oil drum was tripping the unit every 3 hours, forcing the operators to place the FC in manual and close the control valve. The operators requested tuning of the LC.
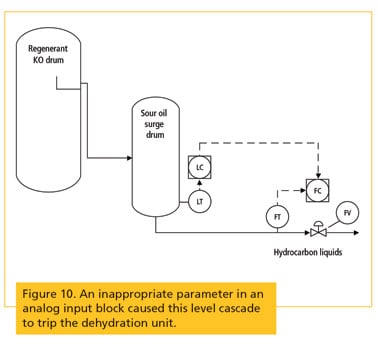
After measuring the process dynamics, we found both the LC and FC already had appropriate PID tuning constants. By studying all signals from both loops, we also found that when the level was trending down, the FC output would decrease appropriately until the flow PV decreased to 5 percent of span. The flow PV then dropped to zero (below the flow SP), so that the FC saw no need to further reduce its output.
The root cause was that the plant was concerned about linearity of the flow transmitter at low flow rates, and therefore had installed a 5 percent low cutoff in the analog input block. But for level control purposes, linearity of the slave flow loop is less important than repeatability. By reducing the low cutoff parameter, we enabled the unit to ride through low-demand cycles without trips.
Master loop parameters for cascade
The cascade loop in the acid gas removal unit shown in figure 11 has a master pressure control loop and a slave flow control loop. The pressure loop responded poorly to regular disturbances from the upstream unit, and attempts to improve the PID tuning were not successful. The data showed the flow control valve was responding adequately, as was the entire slave control loop.
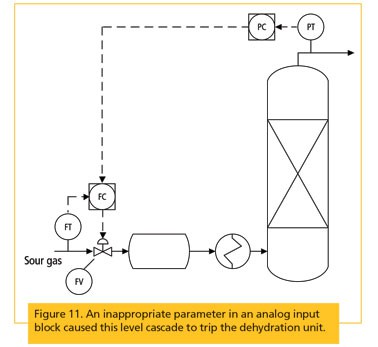
The pressure transmitter responded well, and the master pressure control loop PID tuning was correct, so we continued the search by looking through the control logic. We found and fixed the cause in one of the master loop scaling parameters that was not set for correct coordination with the slave loop.
Lessons
When a control loop is not responding properly, check the tuning first. Test the PV response to controller output and apply a systematic tuning method such as lambda tuning. If this does not solve the loop problem, it will often show you where to look for the root cause.
You may find the cause in the mechanical components, electrical components, software parameters, or configuration. We hope these examples give you some ideas to apply a similar diagnostic process in your plant. Training, tools, and consulting services are also available to assist you.
About the Author
Mark Coughran, a senior process control consultant with Emerson, has optimized the performance of control loops in 84 process plants around the world. Typical results include increased production, faster startup, reduced consumption of energy or materials, reduced operator distraction, and APC projects enabled. His previous assignment with Emerson was to test the installed performance of many makes and models of control valves in the Fisher laboratory.
Connect with Mark
![]()
![]()
A version of this article also was published at InTech magazine.
