

This guest post was authored by Eric Webb, regional account manager at Beamex.
Plants can improve their efficiency and reduce costs by performing calibration history trend analysis. By doing so, a plant is able to define which instruments can be calibrated less frequently and which should be calibrated more frequently. Calibration history trend analysis is only possible with calibration software that provides this functionality. Cost savings can be achieved in several ways. First, by calibrating less frequently where instruments appear to be highly stable according to their calibration history.
Second, by calibrating instruments more often when they are located in critical areas of the plant, ensuring that instruments are checked and corrected before they drift out of tolerance. This type of practice is common in companies that employ an effective “preventive maintenance” regime. The analysis of historical trends and how a pressure sensor, for example, drifts in and out of tolerance over a given time period, is only possible with calibration software that provides this type of functionality. A few calibration software providers offer a history trend analysis function. The history trend analysis enables users to plan the optimal calibration intervals for their instruments.
Once implemented, maintenance personnel, for example, can analyze an instrument, or group of instruments, drift over a certain time period. History trend can display the instrument’s drift over a given period both numerically and graphically. Based on this information, it is then possible to make decisions and conclusions regarding the optimal calibration interval and the quality of the instruments with respect to measurement performance.
The “history trend” window enables users to view key figures of several calibration events simultaneously, enabling evaluation the calibrations of a position or a device for a longer time period compared to the normal calibration result view. For example, the user can get an overview of how a particular device drifts between calibrations and also whether the drift increases with time. Also, the engineer can analyze how different devices are suited for use in a particular area of the plant or process.
When calibration frequency can be decreased:
- If the instrument has performed to specification and drift has been insignificant compared to its specified tolerance over a measured period of time
- Rule of thumb would suggest that if an instrument has been intolerance for at least three consecutive calibration intervals and measured drift has been less than 50 percent of tolerance, the calibration interval for that specific instrument can be increased by 50 percent
- An example of this would be an instrument with a 12-month interval could be increased to 18 months if the criteria stated above were true
- If the instrument is deemed to be non-critical or in a low priority location
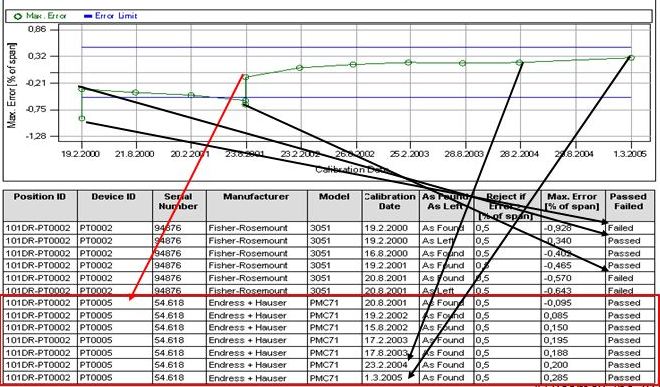 Sample history trend report displays calibration data both graphically and numerically. The first instrument in this position drifted out of tolerance. The second instrument consistently had more stable readings within the tolerances over time. So it could be calibrated less frequently.
When calibration frequency should be increased:
- If the instrument has drifted outside of its specified tolerances during a given time period or has shown history of significant drift, during multiple previous calibration intervals
- If the instrument is located in a critical process or area of the plant and has drifted significantly compared to its specified tolerance over a given time period
- When measuring an instrument that is located in an area of the plant that has high economic importance for the plant
- Where costly production downtime may occur as a result of a ‘faulty’ instrument
- Where a false measurement from an instrument could lead to inferior quality batches or a safety issue
The frequency of calibrating instruments should be determined by utilizing and analyzing available calibration data, criticality of an instrument, as well as taking into account drift over a period of time. A good history trend analysis program can reduce cost, identify areas of concern for process integrity and help to reduce production downtime due to instrument failure. Of course, calibration technicians should also use their best judgment and discretion when examining the history trend information.
Blog Posts
How Often Do Measurements Need to Be Calibrated?
Just in Time, or Just Too Late? A Kaizen Approach to Calibration
How to Improve Industrial Productivity with Loop Calibration
Temperature Calibration: Using a Dry Block to Calculate Total Uncertainty
How Can Advanced Calibration Strategies Improve Control Performance?
How to Calibrate a Pressure Transmitter
Webinar Recordings
Uncertainty in Calibration
Calibration Uncertainty and Why Technicians Need to Understand It
How to Avoid the Most Common Mistakes in Field Calibration
Learn Advanced Techniques in Field Calibration
How to Build an Industrial Calibration System Business Case
How to Use Calibration Tools for Accurate Process Temperature Measurement
How Does Low Flow Affect Differential Pressure Flowmeter Calibration?
Three Common Pitfalls of Pressure Calibration
How to Calibrate Differential Pressure Flowmeters
Free Downloads
ISA Industrial Calibration Worksheets
Measurement Uncertainty Analysis Excel template plus book excerpt
Calibration Handbook of Measuring Instruments book excerpt
In-Depth Guide to Calibration for the Process Industries eBook
Calibration Uncertainty for Non-Mathematicians white paper
About the Author
Eric Webb is a regional account manager at Beamex and is a certified metrologist with more than 20 years of calibration and test equipment experience in service, management, quality and sales. Currently Eric manages sales and strategic accounts for Beamex in Texas and Oklahoma. [/dropshadowbox]
Connect with Eric![]()
