This post was written by Richard Clark, InduSoft Web Studio application developer at Wonderware by Schneider Electric.
Machine and process skid builders can use human-machine interface (HMI) software to improve energy efficiency by measuring and monitoring energy usage, and by then using this data to reduce energy consumption through analysis and optimization.

Through their connection to a variety of monitoring devices and controllers, HMIs provide measurement and monitoring and save the data collected from these components to databases and historians. Once the data is efficiently saved, display, trending, remote access, and big data analysis supply an optimization path.
Most of these machines and process skids are installed as part of larger industrial plants, so optimizing their energy use often involves coordination with other plant processes, resulting in an overall reduction of energy use.
Measuring energy use
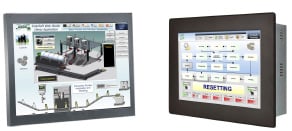
 Figure 1. Both the PC-based HMI on the left and the embedded HMI on the right can be used to measure and monitor energy use.
HMIs, whether PC-based or embedded (figure 1), can connect to a variety of machine controllers, and these connections are required to measure and monitor energy use. Inputs to the controllers—whether a current sensor or other discrete and analog signals—give important machine status and measurement data that can be used to improve efficiency. Components such as power metering devices can often be connected directly to the HMI, simplifying the network architecture.
Devices commonly used for measuring energy use directly related to electrical energy most critical include:
- power meters
- current sensors
- voltage sensors
- flowmeters
But some machines and process skids also use other utilities such as natural gas, water, and compressed air. If this utility usage is significant, it should be measured using appropriate instruments such as flowmeters.
Using HMIs, the machine or process skid operating data can be read and saved in real time. This is important, because this equipment consumes energy at varying rates at different steps in their operating cycles. Once saved, operators and engineers can use this data for real-time and historical analysis.
Databases and historians
Machine and process skid operating data is commonly saved to external databases. However, some machines and process skids need this data locally to maintain process control. When this is the case, the local data can be saved and replicated to a larger database structure such as a plant enterprise resource planning (ERP) system.
An ERP system can be used to predict costs of manufacturing in terms of raw material and resource usage. It can also be used to project trends in operational efficiency, order raw materials, schedule future production requirements, predict batch run times, monitor downstream customer needs, and perform many other business functions.
In some cases, machines and process skids are networked together and may generate a great deal of data that needs to be aggregated for the whole plant production line or saved for regulatory requirements or historical batch information. In this type of environment, plants often employ historians. Historians are specialized high-speed databases designed to process and save many single point values at a time, some as high as millions of points per second. This is far beyond the bandwidth of most standard databases, which can usually only save one record at a time per transaction.
These databases and historians may also be connected to various other processes around the plant, which are also generating process data that must be saved.
With these larger plantwide systems, a historian is basically a necessity. Choosing the right HMI and historian combination is important, because problems can arise if the devices are not initially designed to work together. Although most HMIs can be interfaced with a historian or database, devices initially designed to work together have built-in native connectivity, along with native connectivity to a wide array of devices and protocols.
This native connectivity enables operation at machine speed without third-party connectivity solutions. Additionally, native connectivity may provide advanced data query and analysis methods for the HMI that dissimilar suppliers would not have available except through a third-party solution or add-on.
Monitoring energy use
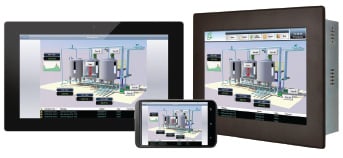
With the measurement data collected and stored, the proper software and networking can push the data to management, engineers, and operators using a variety of technologies. An operator can view the data on a local display and adjust parameters as needed; an engineer can view diagnostic data wirelessly on his or her smartphone or tablet to quickly diagnose problems; and management can view machine energy usage over the past month via a report (figure 2).
 Figure 2: A wide variety of devices, including an embedded HMI, a tablet, and a smartphone, can be used to monitor energy consumption.
These graphical displays of operating data give machine and process skid users actionable information via one or more of methods:
- local access at the embedded or PC-based HMI
- access via an office PC, either via Wi-Fi or an intranet
- in-plant mobile access using a tablet or smartphone via Wi-Fi
- remote access using a tablet or smartphone via the Internet
They can view HMI data in a number of ways and on a wide variety of devices. Depending on the needs of the operators or users, data can be shown, analyzed, aggregated, or displayed—all based on operational requirements.
Operators at a machine, for instance, may be using a local HMI connected to the main HMI, with data displayed directly from this source. The operator could also query local historical data or data from a historian or common database. Depending on the needs and access level of a particular user, a variety of data and control functions can be displayed locally at the machine or process skid.
Another way to view data is through a connected PC within the plant, such as a manager or analyst console located within the local-area network of the business. This type of network connection, whether via wires or Wi-Fi, is typically a thin client.
Thin clients and mobile devices
Other types of thin-client connections, most of which use proprietary hardware and software, are also available from companies specializing in that technology. The thin-client connection is secure, and there is no way for these workstations to affect machine controller operation or disrupt the main HMI. Data access through the thin client is also user specific, with content tailored to the needs of the person logged on at the particular thin client.
Increasingly, mobile Wi-Fi devices such as tablets and smartphones are finding use in the plant to provide operational data, machine efficiency information, and alarm or event alerts. Such data can be in the form of specific screens, grids, and trends designed to be properly displayed on these devices. Maintenance personnel are most often the users of these mobile devices.
To ensure safety and security, individuals using remote-access devices can be required to have the right credentials and be inside a “fence” surrounding (e.g., in proper proximity of) the machine, and even have to read a barcode on the machine. These precautions allow the mobile devices within the plant to continue to be generic and platform agnostic, but become specific user tools when they are needed. The precautions are required to maintain the security needed to make the process and plant safe.
Mobile devices connected via cellular networks or the Internet are also useful for displaying and showing data, events, and alarms. Most applications displayed on these mobile devices are configured to send data only, with no remote control allowed. However, under certain circumstances, alarms may be allowed to be acknowledged by an authenticated user who is physically outside the plant domain. Additionally, these mobile devices are finding widespread use in isolated areas such as tank farms, pipeline fields, and electrical substations.
Optimizing energy use
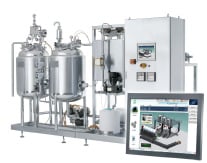
 Figure 3. The embedded human-machine interface installed on this process skid can be used to display both real-time and historical energy use.
With machines or process skids (figure 3), the analysis of real-time and historical energy efficiency data provides valuable insights. Using historical data, plant engineers and management can analyze efficiency data over time and compare it to baseline energy usage.
A key part of this analysis is comparing energy use with machine and process skid operating data. For example, it is very important to know how much energy the equipment is using at each state of operation. If a machine is consuming a high amount of energy at idle, then the machine can be completely shut down when not in use, or it can be modified to consume less energy at idle.
When energy use spikes during operation, finding out why usually requires examining a number of machine or process skid operating parameters, such as speed of operation and process temperatures.
Understanding machine or process operation along with operational efficiency—and comparing this information with past performance profiles—is crucial to saving energy and tuning the equipment for better performance and efficiency.
Using historical data
Historical data can be useful for trimming raw material usage in existing processes, which ultimately saves energy. Historical data can also be used for modeling processes when a new product is being introduced. This data allows the engineer or production personnel to determine the most efficient way to run the product through the machine or process skid.
Plants can find valuable insight into the health of the machines and process lines in historical and real-time data, such as when to schedule maintenance. The data can be used to estimate need and/or replacement, or to overhaul the equipment to make the process more energy efficient. For example, data from a large compressor skid may uncover increased gas usage. This data can help uncover leaks or inefficiencies in downstream equipment and machines. Trend alarms can be set using this data, which will alert maintenance or investigative teams to uncover root causes and improve efficiency.
Historical and real-time data can also help forecast electrical demand when negotiating contracts for electrical usage with power utilities. Incorrect forecasting resulting in either high or low electrical use can result in huge penalties from the utility.
Monitoring machines and process skids carefully can help personnel properly forecast a context for energy usage using advanced production models and forecasting software. Both historical data and real-time data is needed to assess when a machine is using more energy than expected. This may be due to different raw materials that are harder to process or other factors that have not been encountered before. Without being able to compare current to historical data, these increases in energy consumption may go unnoticed.
The same data can be used to measure “rebound effects” that show the efficiency of a device is improving. With improved efficiency, the device may be utilized more at a lower cost, or money saved from increased efficiency can be used on more costly processes.
As the HMI measures, monitors, and collects real-time and historical data, this information can be used as a resource for competitive advantage. Not only can the data be used to save money, collect process parameters, and forecast maintenance, resources, and other manufacturing execution system functions, it can also measure, manage, and optimize energy use of machines and process skids.
About the Author Richard Clark, InduSoft Web Studio application developer at Wonderware by Schneider Electric, has extensive and in-depth technical expertise encompassing information technology, process and control systems engineering, and mechatronics.
A version of this article also was published at InTech magazine.


