This article was written by Lindsey Fink, a field services engineer at Control Station, Inc., and Dennis Nash, president of Control Station, Inc.
The data historian has evolved. Since its introduction in the 1980s, the historian has transitioned from a simple repository of production data to a treasure trove of operational and business intelligence. Whether required by regulatory fiat or deemed necessary for emergency backup, the historian was originally a cost center in the eyes of many and offered what was generally viewed as limited application value. Storage was expensive, so data was limited. That calculus has changed as the cost of data has dropped and the value of analytics has soared.

At the time of the historian’s introduction, plant staff in a centralized control room actively monitored most data of any immediate consequence. Up to that point best practice was to continuously capture performance changes using simple paper-based data loggers. Such state-of-the-art technology constrained a production staff’s effectiveness, because their awareness of performance issues was limited to information scrawled across individual rolls of paper. Looking back at an individual loop’s performance was time consuming. The effort needed to assess interaction between multiple loops was impractical. Over time the historian would overhaul that model.
Today’s data historian is the key for capturing a facility’s business-critical performance information. Whereas historical sample rates—the speeds at which data was sampled for storage—were once set for one to five minutes, they are now configured to collect data at subsecond intervals for loops located across a facility’s control infrastructure. With the improved resolution, staff can analyze subtleties in control previously masked by aliasing. Able-minded staff can uncover insights from past performance to both ward off future downtime and increase production efficiency.
A preponderance of data is now available; there is so much data that the data historian and other databases have become a driving force behind the booming Industrial Internet of Things (IIoT). According to IDC Research, that force is growing at a meteoric rate. In its report published in December 2014, IDC projected a universe of more than 4 trillion gigabytes of IIoT data by the year 2020—ten times more data than what was available just four years ago. The rapid growth in data can largely be attributed to lower-cost sensors and data storage—costs that are expected to fall further as the rate of data generation simultaneously increases. As a result, manufacturers now have access to a more financially sensible means for capturing and storing data. Higher-speed data is improving the historian’s overall utility.
Help wanted: IIoT capabilities
Although the sheer volume of data available today is staggering, it is the similarly impressive evolution in computer processing power and software-based analytics that is currently empowering production staff. Like the data historian, processing power has evolved, and it has benefitted similarly from a combination of improved economics and capabilities. The cost of computer memory continues to plummet, while processing speeds steadily accelerate. Consider that in 1980 a megabyte of memory could cost tens of thousands of dollars, but today a 32 gigabyte flash drive costs less than $10. In terms of processing speed, Intel’s 8088 microprocessor released in the early 1980s was capable of up to 330 thousand instructions per cycle. The Pentium III chips released in 1999 could process more than 2,054 million such instructions. These two factors alone have facilitated dramatic changes to industrial uses of historical data.
 Figure 1. Like predictive analytics technologies, CLPM solutions actively monitor performance of essential resources—a facility’s regulatory control systems. As a part of the broader IIoT revolution, these solutions focus on improving plant floor operations.
Software too has benefited from an ongoing information technology evolution and advances in multithreaded, multivariable computation. As evidence look no farther than the dynamic clustering, machine learning algorithms that industrial automation giants apply using highly sophisticated predictive analytics technologies. They tap into the data historian and establish virtual fingerprints of past events, from normal operation to abnormal failure states. When applied to current process conditions, these complex forensics can forecast failure and help operations avoid the excessive costs of unplanned downtime. Striking big data and analytic applications of these technologies are improving uptime in a number of applications, including aircraft jet engines and locomotives.
It is true that IIoT and the promise of improved operational intelligence have captured both headlines and imaginations, but much of the focus has been on IIoT’s impact on the broader supply chain and not on improvements to plant floor operations. IIoT’s value lies at the intersection of exhaustive data access and comprehensive interoperability between and among information systems, such as the data historian. Consulting firm McKinsey & Company projects the value of IIoT will reach $11.1 trillion by 2025. Optimizing industrial operations and equipment alone is projected at $3.7 trillion during the same time frame. In the face of these enormous expectations, there is growing demand for IIoT and the data historian to produce additional benefits for current-day plant floor operations. In particular, engineering staffs are pressing for tools that leverage the data historian locally and provide actionable intelligence for maintaining safe, profitable operations.
Plant-wide perspective
Control loop performance monitoring (CLPM) solutions were first introduced at the start of the new millennia. They promised plant-wide and near real-time analysis of proportional, integral, derivative (PID) control loop health, accessing the stores of data contained within the historian. Enhanced awareness of the regulatory control layer complemented a facility’s other existing supervisory control capabilities. Initially outfitted with a portfolio of key performance indicators (KPIs), CLPM solutions let production staff respond proactively to changes that affected performance of an individual loop, a unit operation, or even at a plant-wide level. The effectiveness of these early solutions depended heavily on their access to high-resolution process data. Without sufficient data resolution, CLPM solutions were limited in their ability to accurately assess factors affecting production in general and control in particular.
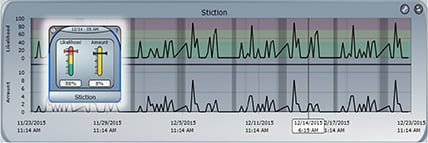
 Figure 2. Stiction is widely considered the most common issue effecting control loop performance. Today’s CLPM solutions can isolate this issue and quantify its impact.
Stiction, static friction that needs to be overcome to enable motion of stationary objects, consistently ranks as the most challenging mechanical issue facing process engineers. Whether linked to a valve, a damper, or other final control element (FCE), stiction hinders effective control of the process. An FCE affected by stiction cannot adjust smoothly in response to changes in the control loop’s process variable. Rather, it can only respond when excessive force is applied. Although the added force allows the FCE to overcome the static friction, adding force generally throws the process into a cycle that demands recurring action by the FCE and accelerates wear and tear on the associated process equipment. Early CLPM solutions looked for this behavior, but they frequently lacked the data resolution to either isolate the telltale signs or to gain additional insight.
Identifying stiction is important, but so is quantifying it. With access to high-resolution data, most CLPM solutions can now pinpoint the bad-acting FCEs as well as quantify the amount of stiction present. The combination of these two sets of data enables production staff to assess the true effect of stiction on process control and the facility’s production. It also lets workers prioritize increasingly limited resources in the remediation of such mechanical issues.
As with predictive analytics and other advanced analytical technologies, CLPM solutions have benefited from the increase in resources stored within the data historian. With the addition of statistical correlation and interaction analysis features and access to high-resolution data, the value of CLPM solutions has shifted from the simple task of tracking individual loop performance to the more impactful role of facilitating plant-wide process optimization. Many of those opportunities for optimization have their roots in everyday process events.
Capturing everyday events
Digging deeper into the data historian uncovered new sources of value in the form of ordinary regulatory control loop events. Set point changes are among the countless and seemingly mundane events that the data historian records. Whether changes to set points or manual output adjustments, these events cause a shift to the associated PID loop’s controller output, and they occur frequently. It is estimated that a typical production facility experiences hundreds, if not thousands, of set point and manual output changes daily. Like the bump test performed when tuning a PID control loop, set point changes can supply the information needed to model loop dynamics and to generate tuning parameters.
The ability to automatically capture and model manual output changes using historic process data was first introduced in 2005. Where available, the feature applied traditional process modeling and PID controller tuning routines. Upon isolating a manual output change, the CLPM solution could then establish the dynamic relationship that existed between the loop’s controller output and process variable. The modeled relationship could then be used to calculate a first-order model. However, oscillatory process conditions common to industrial production processes routinely limited the feature’s efficacy.
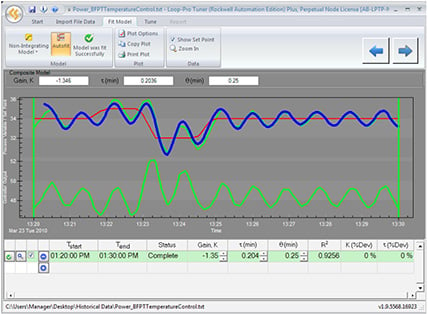
 Figure 3. NSS modeling can accurately model highly dynamic process conditions common in industrial applications. The trend above shows a model (blue) that accurately describes the oscillatory dynamics of the underlying process data (green).
Like most tuning software of the time, early CLPM solutions equipped with the active modeling feature struggled to accurately account for highly variable process conditions. Oscillatory behavior was—and still remains today—a staple characteristic of data produced from industrial control systems. While data historians contained the necessary details, innovations in nonsteady-state (NSS) modeling that would ultimately resolve the challenge of oscillatory conditions did not enter the automation market until 2008. Another four years would pass before NSS modeling capabilities were incorporated into CLPM platforms.
Overcoming historical challenges
High-resolution data from the historian enhanced the accuracy of a calculated model, but traditional controller tuning technologies still required a steady-state condition at the start of a given step test. The steady state provided a known condition with which first-order model parameters could be established. An automated optimization routine could then single out the model that most accurately reflected the process’ true dynamics (e.g., highest R2 value—coefficient of determination). Without such a steady state, however, modeling and tuning software routinely failed. No known condition existed upon which to base the model parameters.
When considering value, keep in mind the historian’s role in capturing the data used in loop tuning and process optimization. In its 2001 companion guide Invest in Control – Payback in Profit, the Carbon Trust credited regular controller tuning with increases of 2-5 percent in throughput and 5-10 percent in yield. For the average power plant that amounts to additional annual revenues of nearly $2 million. For a typical chemical plant, the amount surges to approximately $5 million per year. Because the plurality of production processes in need of tuning also involve oscillatory conditions, the basic data requirements went unmet until NSS modeling was introduced and established a new standard.
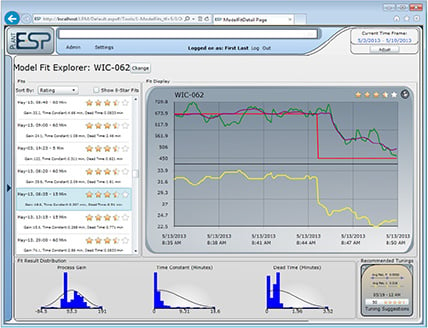
 Figure 4. CLPM solutions uncover opportunities for optimization by automatically isolating and modeling everyday set point changes stored in the data historian. By aggregating these models, CLPM solutions can illustrate how tuning parameters evolve over time.
NSS modeling eliminated the steady-state requirement and reopened previously shuttered opportunities for loop tuning and process optimization. Whether data in the historian was sourced from a controller operated in open or closed loop and regardless of the process type (i.e., integrating versus nonintegrating), NSS modeling consistently produced tuning parameters that improved performance. At an even more basic level, NSS resolved the concern expressed by many practitioners. Achieving a steady state was the reason for applying tuning software and not a convenient starting point required by the technology. With the integration of NSS modeling in CLPM solutions, the historian and its volumes of everyday set point changes became an immediate source of opportunities.
Harnessing innovation
CLPM solutions equipped with NSS modeling benefit manufacturers by sourcing innumerable opportunities from the data historian for optimization in near real time. Heuristics in the software automatically eliminate disturbance-driven data stored in the historian, leaving the majority of everyday set point changes for automated modeling. As multithreaded application technologies improve, these CLPM solutions are able to easily analyze thousands of set point changes and generate a nearly equal number of models each day. Likewise, they are capable of performing composite analysis across multiple models associated with the same PID loop, showcasing the loop’s performance across a range of operating conditions.
The combination of high-resolution data, processing power, and advanced analytics allows the CLPM solution to provide valuable insights. Indeed, ranges of tuning parameters for individual PID loops can be based on hundreds of models averaged together. The aggregation shows how the optimal tuning range changes over time. Equally important, it ensures that individual outliers have a minimal effect on the overall results.
As a result of advances in computing power and software analytics, the bits and bytes stored within the typical data historian have increased in value. Technologies, such as CLPM solutions, are applying novel capabilities to both capitalize on everyday process events and produce new value. No longer limited to simple alerts and KPIs, CLPM solutions deliver true IIoT capabilities to staff on the plant floor.
About the Authors
 Lindsey Fink is a field services engineer at Control Station, Inc., and is responsible for application deployment and support. Fink was previously a senior nuclear engineer at Westinghouse Electric. Dennis Nash is president of Control Station, Inc., and manages the company’s overall growth strategy.
 Dennis Nash is president of Control Station, Inc., and manages the company’s overall growth strategy. He assumed control of the company in 2004.
A version of this article also was published at InTech magazine.


