

This guest post was written by Greg McMillan, industry consultant, author of numerous process control books, 2010 ISA Life Achievement Award recipient and retired Senior Fellow from Solutia Inc. (now Eastman Chemical).
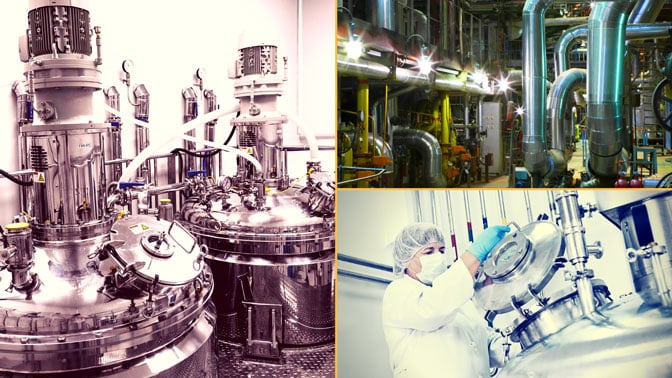
Ultimately what we want to know and control is the concentration of key components. Relatively inexpensive inline measurements can be used under the right conditions to provide concentration measurements. Understanding the limitations as well as the capabilities is essential to success. Here we look at how we can elevate the use of capacitance, conductivity, density, pH and turbidity to provide process knowledge to control biological and chemical reactor concentration.
The inferential measurement of the concentration of a component (e.g. reactant or reagent) in a feed, exit, or recycle stream or vessel is possible if the component of interest has a large definitive effect on capacitance, conductivity, density, pH, and turbidity. To infer composition in vessels, sensors are installed in nozzles on the vessel, in recirculation lines, or sample lines in close proximity to vessel.
If the component of interest has a higher conductivity than other components or solvent, conductivity can be used if the conductivity is restricted to be always on one side of the peak in the conductivity curve. The process gain changes sign as an operating point crosses the peak, which is disastrous to a control loop because the PID control action sign must be the opposite of the process action sign (assuming valve action is correctly configured).
If the PID has the wrong sign, the PID output will ramp to its output limit. Plots of conductivity versus concentration have a peak if the entire concentration range is covered. A few ionic species such as sulfuric have two peaks. The second peak for sulfuric acid occurs at 93 percent concentration.
The measurement and control of biological and chemical reactors is the key to product quality and the yield and production rate of most processes in the process industry. See Greg McMillan's ISA book Advances in Reactor Measurement and Control for an extensive view of practical opportunities for building and effectively using online estimators to improve process knowledge and control.
For product conductivity that traverses across the peak, concentration control cannot start until the conductivity is well to the right of the peak. For a very low concentration of a single acid and base (e.g. < 0.01 percent) pH provides a more sensitive inferential measurement of concentration.
Insight: One or more signal characterizer blocks are used to give a piecewise linear fit that enables the online computation of the X axis ( percent concentration) from the Y axis of a conductivity plot or pH titration curve generated from samples at various operating conditions.
For conductivity and pH, a signal characterizer is commonly used to compute the X axis (e.g. salt, acid, or base ion concentration) from the Y axis (conductivity or pH). The 20 or more data points of signal characterizer is usually enough to provide a piecewise linear fit. The points are more closely packed in the operating regions of greatest interest or nonlinearity. A cascade of characterizers can be used to provide greater resolution where a secondary signal characterizer is added to the output of the primary characterizer. A simple temperature correction should be generated based on the results of samples that cover the entire possible range of temperatures including abnormal operation.
Insight: The effect of process temperature on the actual conductivity and pH of the sample must be measured and used in customized solution pH or conductivity temperature compensation.
For a two component liquid mixture where the density the components differ by more than 1 percent an extremely accurate concentration measurement is attainable by the use of a Coriolis meter. The accuracy of the density measurement in Coriolis meter is 0.0002 gm/cm3. There is no drift and installation effects are essentially negligible. The meter never needs recalibration. There are no upstream and downstream straight run or field calibration requirements. High performance meter designs are now able to measure the concentration of bubbles and solids as well. The use of Coriolis meters on raw material feeds provides not only an incredibly accurate true mass flow measurement independent of composition but also an inferential concentration measurement from density.
Insight: An extremely accurate and drift free measurement of liquid density by Coriolis meter can be used as an inferential measurement of concentration in a two component mixture.
Turbidity offers an inferential measurement of biomass concentration for bioreactors. The turbidity measurement does not distinguish the number of cells or how many are alive (viable) or dead (lysed). The addition of a capacitance probe to provide a dielectric spectroscopy can provide inferential measurements of cell size, homogeneity, and membrane integrity. Viable cells have membranes intact whereas lysed cells have holes or fractures in their membranes.
Insight: Dielectric spectroscopy in combination with an inferred measurement of biomass from turbidity can provide inferential measurements of cell size, and the relative concentration of viable (live) versus lysed (dead) cells.
The inferential measurement of concentration must be periodically corrected by taken a fraction of the error between a synchronized computed concentration and an at-line or off-line analysis result. The synchronization is achieved by passing the change in concentration through dead time and integrator blocks with the proper sign of process feedback to match process dynamics and then adding the change to an original corrected value and passing the result through a final dead time block representing the analysis delay.
To get the most out of inline meters and probes, fundamental relationships should be used to compute concentration measurements. The computed concentration measurements must be gradually corrected by comparing the computed concentration synchronized with an analysis result somewhere and sometime whether in the field, plant lab, or offsite lab.
About the Author Gregory K. McMillan, CAP, is a retired Senior Fellow from Solutia/Monsanto where he worked in engineering technology on process control improvement. Greg was also an affiliate professor for Washington University in Saint Louis. Greg is an ISA Fellow and received the ISA Kermit Fischer Environmental Award for pH control in 1991, the Control magazine Engineer of the Year award for the process industry in 1994, was inducted into the Control magazine Process Automation Hall of Fame in 2001, was honored by InTech magazine in 2003 as one of the most influential innovators in automation, and received the ISA Life Achievement Award in 2010. Greg is the author of numerous books on process control, including Advances in Reactor Measurement and Control and Essentials of Modern Measurements and Final Elements in the Process Industry. Greg has been the monthly "Control Talk" columnist for Control magazine since 2002. Presently, Greg is a part time modeling and control consultant in Technology for Process Simulation for Emerson Automation Solutions specializing in the use of the virtual plant for exploring new opportunities. He spends most of his time writing, teaching and leading the ISA Mentor Program he founded in 2011.
Connect with Greg:![]()

