

This article was written by Andrew Gentile, PE, lead facilities engineer at Andeavor Logistics and Sheldon Schultz, PE, is the general manager of Yanke Energy, Inc.
Fuel delivery is a common problem in biomass plants. Wood fuel is not uniform in shape, density, moisture content, ash content, or energy content. In plants operating in manual mode, an operator makes a fuel adjustment every 5 minutes. More often than not, the adjustment is excessive, causing predictable system oscillations, which cause decreased efficiency, boiler upsets, lower steam production, and emissions violations. The fact that wood fuel is problematic is the justification many plants use for resorting to manual fuel control.
For plants that use automated fuel control, a pressure-based controller is the most common. A pressure-based controller depends on variations in drum pressure to make fuel adjustments. Percent oxygen (O2) is a leading indicator of drum pressure; therefore, a pressure-based controller is slower and less accurate than an O2-based controller. An O2 controller can predict pressure errors and adjust the fuel rate before the error occurs. An O2-based fuel controller stabilizes the combustion process, which increases steam flow, reduces average percent O2 (leading to greater fuel efficiency), and reduces the chances of emissions violations. A well-designed controller will pay for itself within a year.
The controller concept
Figure 1 shows a characteristic curve for a theoretical boiler. The curve represents the interrelationships between swings in O2, load efficiency, and the production of carbon monoxide (CO) and nitrous oxide (NOx). The corner point is the ideal percent O2 operating point for a given boiler. Each boiler has a unique ideal operating point. The role of the O2 controller is to stabilize the combustion process around the boiler’s ideal operating point. Given a fixed amount of air flow into the furnace, the controller varies the fuel rate to maintain a percent O2 set point. The operator selects the amount of air flow based on the desired steam flow or megawatt (MW) output. Because the air is constant, the percent O2 in the flue gas only increases if the amount of air being consumed in the combustion process decreases. Increasing percent O2 is a leading indication of decreasing drum pressure and steam production. A decrease in percent O2 in the flue gas occurs if the amount of air being consumed has increased; decreasing percent O2 is a leading indication of increasing drum pressure and steam production.
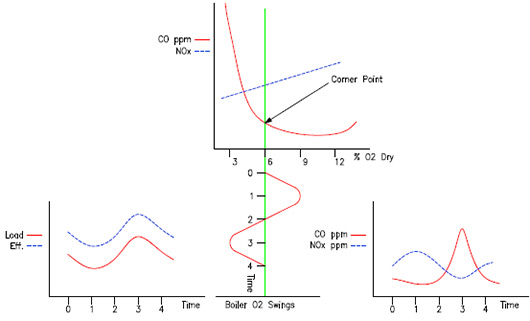 Figure 1. Characteristic curve of boiler
Case study
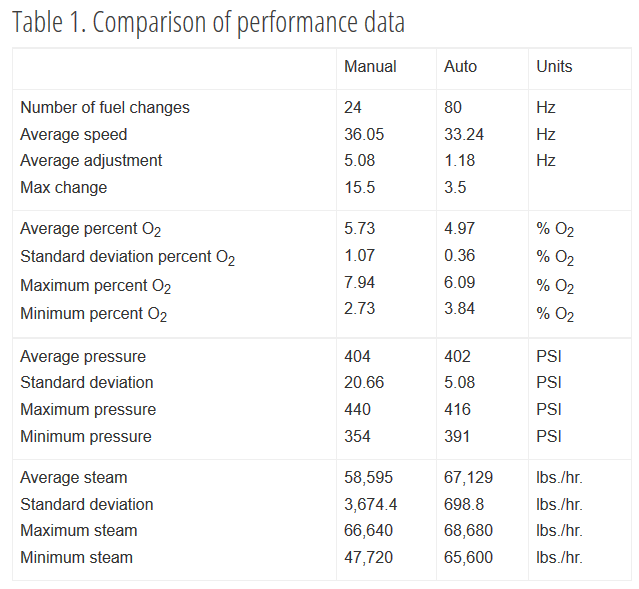
An O2 controller was installed in boiler #1 in 2010. Process data was collected in 1 minute increments on 8 June 2010. Steam flow, drum pressure percent O2, feed rate, and control mode (auto or manual) were collected. The data elements are represented as a percentage of their respective averages. This was done to compare the data on relative terms. Actual values are in table 1.
Manual control results
Figure 2 shows 100 minutes of percent O2 and feed screw speeds while operating in manual mode. The changes in percent O2 vary inversely as the metering screw speeds. Percent O2 lags the changes in fuel rate by about 1 minute. The range of percent O2 in figure 2 is 2.73 percent to 7.94 percent.
The three severe dips in percent O2 at the beginning of figure 2 can be directly correlated to increased CO levels. CO is used as a surrogate volatile organic compound by maximum achievable control technology as an indication that other hazardous air pollutants are present. The three peaks in percent O2 in the middle of the graph can be correlated to lost revenue from decreased steam production.
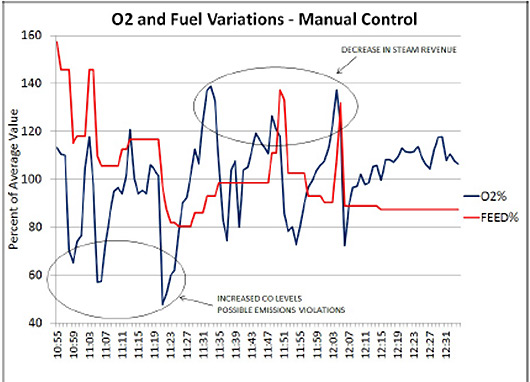 Figure 2. Percent O2 swings based on fuel variations, manual
The metering screws are controlled by variable frequency drives (VFDs); screw speeds are entered by the operator in hertz. In 100 minutes, the operator makes 24 changes ranging in magnitude from –15 Hz to 10 Hz, with the average adjustment magnitude of 5.08 Hz. The average VFD speed is 36.05 Hz.
Figure 3 shows variations in steam flow and drum pressure with feed screw speeds. Steam flow and pressure respond similarly to changes in fuel rate, both lagging the fuel changes by about 5 to 6 minutes, which mean they lag changes in percent O2 by about 4 to 5 minutes.
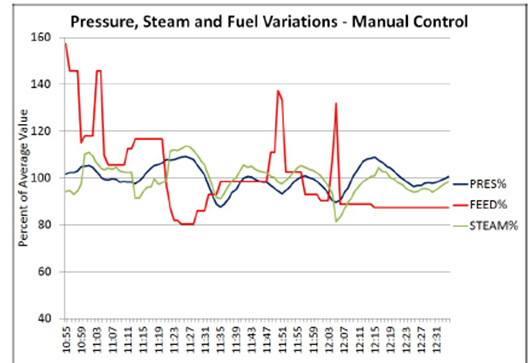 Figure 3. Pressure and steam swings based on fuel variations, manual
Automated control results
Figure 4 shows 100 minutes of percent O2 and feed screw speeds while operating in auto mode. The controller set point was 4.97 percent. The range of percent O2 shown is 3.84 percent to 6.09 percent. The average percent O2 was 4.97 percent. Note that the magnitude of changes is much smaller than it was in manual mode. In 100 minutes, the controller makes 80 changes ranging in magnitude from –3.5 Hz to 2 Hz, with the average adjustment magnitude of 1.18 Hz. The average VFD speed is 33.24 Hz. (It is likely that the controller made more than 1,000 speed adjustments in 100 minutes. The data collection was set up for 1 minute intervals, and so higher frequency changes are not represented.)
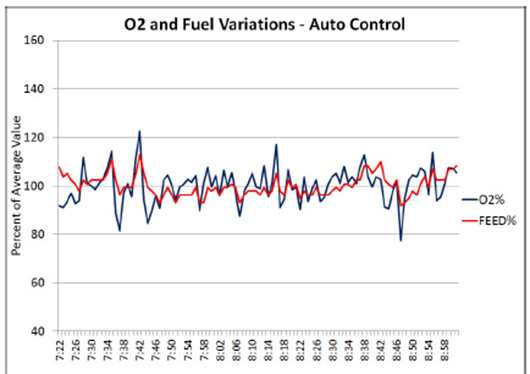 Figure 4. Percent O2 swings based on fuel variations, auto
Figure 5 shows variations in pressure, steam, and feed screw speeds while in auto mode. The steam flow is higher and more consistent than in manual mode. The average steam flow shown in figure 5 is 67,129 lbs per hour with a standard deviation of 698.9 lbs. per hour. This represents approximately 1 percent variance from average.
Note the differences in pressure and steam waveforms between figures 3 and 5. In manual mode, the pressure and steam waveforms are nearly sinusoidal. In figure 5, there are still some oscillations, but the frequency is much lower and the magnitude smaller.
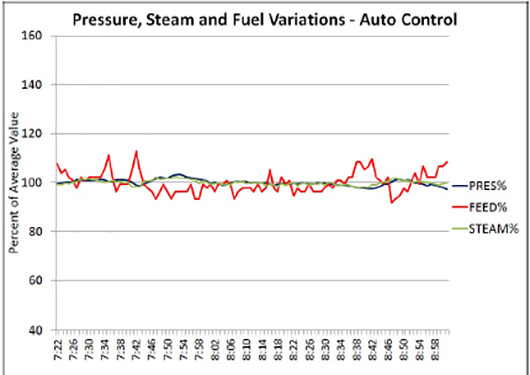 Figure 5. Steam swings based on fuel variations, auto
Comparison of data
The average steam production for the manual control data was 58,595 lbs. per hour; the average steam production for the auto control data was 67,129 lbs. per hour. This is an increase of 14.6 percent, or approximately 1 MW in electrical output. (Note that the case study assumes that the same fuel was used throughout the course of the day. No information is known about possible changes in fuel quality, which may have contributed to the improvement in steam production.) At 6¢ per kWh, this represents a potential increase in revenue of $480,000 per year. Furthermore, it can be inferred from figures 2 and 3 that in manual mode the CO emissions were significant, and in the auto mode the emissions were negligible.
To maximize steam flow and to minimize emissions problems, the combustion process must be stable. An O2 controller is designed specifically to stabilize combustion. Although a pressure-controlled system may be better than a manual system, a pressure-controlled system is designed to correct an error in drum pressure that has already happened. An O2 controller can predict and prevent the error from happening.
In the case study of boiler #1, the O2 controller helped the plant to produce more steam. It enabled the plant to run with a lower average percent O2, lowering operating costs, and the increased stability of the combustion process helped to minimize emissions violations.
About the Authors
 Andrew Gentile, PE, is lead facilities engineer at Andeavor Logistics. Previously, he was president of Gentile Engineering, Inc. where he does design work in electrical power distribution and control systems. He is currently working in the petroleum industry developing control standards for distributed networks in pipeline applications.
Connect with Andrew:![]()
![]()
 Sheldon Schultz, PE, is the general manager of Yanke Energy, Inc. Schultz has designed, built, and operated numerous renewable energy generation facilities. He is currently doing consulting work for biomass facilities. He specializes in improving boiler performance and emissions control.
Connect with Sheldon:![]()
![]()
A version of this article also was published at InTech magazine.
