This post was written by Michael Warren, senior consultant at Asset Optimization Consultants, Inc.
In process manufacturing, established operating procedures describe tasks to perform, data to record, operating conditions to maintain, samples to collect, and safety precautions to take. But do you have the right data to get the key insights to act upon? Do you have access to all the data for a particular asset? And is that data current? In today’s digital revolution, cloud computing, improved analytics, and increased mobility are driving big data and productivity in the energy and manufacturing sectors. While more capable device/sensor technology and enhanced processes have improved the reliability and accuracy of data, organizations still struggle with how to leverage that data operationally and strategically—to better manage reliability strategy and operational risk. What is needed is increased connectivity and convergence of plant automation and business systems.
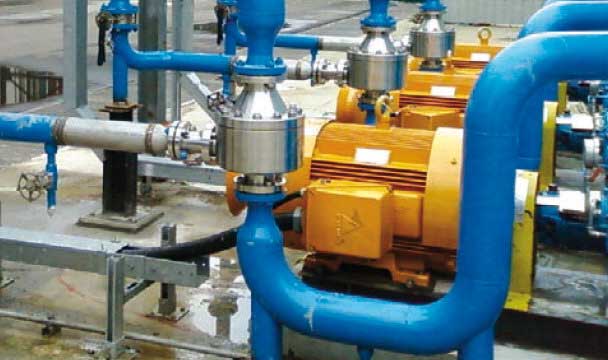 Pumps and valves control the lifeline of process industry, but how often should you inspect? Figure source: http://www.wermac.org/images/valve_arv3.jpg
With increasing pressures to optimize costs and reduce the risk of industrial incidents, it is critical that inspection and maintenance efforts be streamlined for utmost efficiency. Balancing inspection costs with safety and regulatory compliance can only be achieved by understanding the risk that an asset poses to a manufacturing facility.
Similarly, advances in cloud computing, analytics, and mobility are also starting to change manufacturing operations. Recent advances have enhanced older processes and provided a new perspective to daily operations. The technological breakthroughs are creating new insights and operational efficiencies across the enterprise.
But with the proliferation of smart systems, connected assets, and mobile devices, there has never been a greater need for an integrated risk-based inspection (RBI) software solution to manage the overwhelming amount of data generated from these systems and for sound, comprehensive asset strategies. With the number of different systems and devices purchased from myriad equipment manufacturers, the problem can seem overwhelming for many organizations. This growing complexity contributes to the need for an integrated ecosystem to connect assets and enable better assessment and insights.
The convergence of these new connectivity options and data is driving the need for systems that show the enterprise a 360-degree view of its assets. Collaboration between organizations and providers is critical to advancing to the next stages of manufacturing software evolution. That is a main reason why strategic partnerships between industry vendors continue to grow, with technology providers in particular driving deep analytics for more informed decisions surrounding asset investment, maintenance, and operation. Capturing, analyzing, and turning data into actionable information in heterogeneous plant environments requires a manufacturer-agnostic ecosystem that creates measurable opportunities.
How inspection affects APM
Asset performance management (APM) software is all about connecting people, information, and devices to create a holistic view of plant operations. Organizations use APM to better manage operational reliability strategies and risk. And for any complete asset performance management approach, one step can be the most critical: inspection.
An effective mechanical integrity program has the necessary inspections for an overall asset performance management process. Inspection that uses risk-based strategies promotes the mechanical integrity of process equipment. In turn, that results in quick, measurable value through improved reliability, safety, and business profitability. Balancing inspection costs with safety and regulatory compliance can only be achieved by understanding the risk that an asset truly poses to an industrial facility. Safe, profitable organizations use risk-based inspection as the methodology to assess the probability of failures against consequences to optimize inspection activities based upon overall risk.
There are three important characteristics of inspections: internal inspections, the number of inspections, and confidence in the inspections.
Internal inspections
Inspections for internal degradation mechanisms can be completed by visually observing the interior surface or by nonintrusive, nondestructive evaluation methods, such as eddy current testing. Each type of internal damage mechanism has a corresponding inspection strategy rule set that establishes the type and extent of the inspections required. Based on the risk rating, the internal corrosion probability category, and the type of corrosion expected, a percentage of the internal surface area of vessels containing pressure is visually inspected. If entry into the pressure vessel for internal visual inspection is not possible, then take thickness measurements on the head and shell courses and the nozzles. For vessels not in the high-risk rating, internal visual inspections may be reduced or eliminated if damage is not detected. For piping equipment, monitor the internal surfaces by taking thickness measurements. The thickness measurement locations depend on the configuration of the piping, and the number of locations is dependent upon the risk rating.
Number of inspections
An equipment item is given credit for each inspection performed to detect a particular mechanism. The total number of inspections for internal corrosion of pressure vessels is the number of internal visual inspections and the number of external ultrasonic testing inspections. For piping, it is the number of times the internal surface of the piping was monitored by taking thickness measurements. Under certain conditions, the results from an inspection performed on an equipment item can be representative of other equipment items that are within the same service, are exposed to the same operating environment, experience the same corrosion type, and are constructed of the same material. Therefore, if one equipment item is inspected, then the other items with the same conditions also receive credit for one inspection.
Inspection Confidence
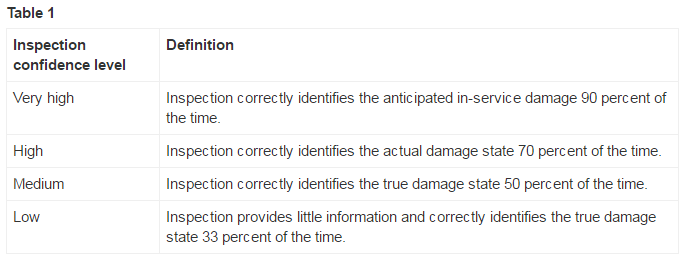
The inspection confidence is based on the type of inspection performed and the extent of the inspection. A confidence level (table 1) is assigned according to how well the inspection identifies the anticipated corrosion damage. If the date of the last inspection is later than the maximum allowable interval for inspection, then the confidence level for that particular inspection should be reduced by one level. If credit is given for representative inspections, the inspection confidence level assigned for the items with the representative inspections is lower than the confidence level assigned for the items that are inspected.
The probability and consequences of failure are determined through an assessment. The assessment should be based on identified degradation mechanisms, defined failure modes, design data, process data, 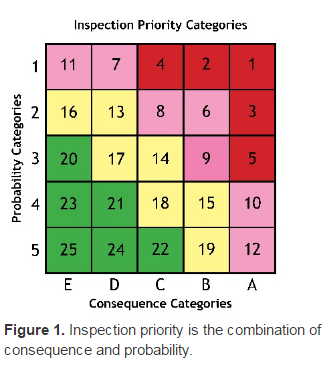 inspection and operating history, and equipment location relative to human and environmental influences. Based on this assessment, the relative probability and consequence of a failure are determined. These values are plotted on a matrix (figure 1), with the location of the point in the matrix indicating the risk ranking associated with the item. Items that have both a probability and consequence of failure greater than the acceptable risk defined by the owner or user will require the most attention from inspection and other mitigation actions. Although this can be accomplished using common computer tools such as Word or Excel, a more structured software tool increases the efficiency and accuracy of an assessment and helps record the data in an actionable, resourceful way.
Once that inspection has taken place, how will the data become information? And who needs access to it?
Driving data from the plant floor to the c-Suite
Increased connectivity and convergence of plant automation and business systems is also driving the need to move data from the plant floor to the c-Suite for better, more informed decision making about achieving operational excellence. Today’s organizations collect billions of pieces of data every day—both structured and unstructured data. But how is that information made meaningful and then shared with the c-Suite?
Typical data flows are convoluted. The process begins with workers on the plant floor who are collecting, analyzing, consolidating, and periodically updating data to a remote operation center or central reporting system. The data is collected from multiple plants and analyzed, elaborated upon, packaged, and reported to management and perhaps the c-Suite. This data is often fragmented and dispersed across multiple applications. By the time the packaged data makes it to management, it may be inaccurate, inconsistent, or even out of date. Organizations need a better way for the c-Suite to use the real-time information that is available on the shop floor. With industry partners, the goal is to deliver a near real-time environment where the asset and production data is collected, even across multiple plants. With enhanced asset management and data analysis, plant operators and executives can optimize production, better understand the asset life cycle, improve safety, and manage operational risk for real advantages in their industry segment.
In our very connected world, industry has been moving away from a layered architecture to a near-real-time fluid environment to dramatically improve the quality of strategic decisions. But the road to delivering timely, relevant insights to the c-Suite includes a couple of challenges. First, many organizations now outsource key aspects of maintenance, inspection, operations, and remote monitoring. Gartner says that by 2017 half of all manufacturers will have some dependency on original equipment manufacturers or third-party service providers to monitor and maintain their equipment. This layer of separation from critical assets makes it challenging to leverage data for internal decision making and to measure the performance of third-party contractors. Will your third-party provider measure to your standards and asset strategies? Can it help mitigate the risks you have identified through your strategies and operational practices?
The second challenge is managing that data: what do you do with all that data from all those devices? How do you know if you are effectively applying smart technology to the right assets? Some assets may not need to be as smart as others, and it is critical to understand which assets and data and which operating parameters you need to monitor. More importantly, are you combining the right data to get the key insights to act upon? With all the data coming in, are you bringing it together in context and with a set of analytical tools to make sense of it and drive action and improvement?
Apply APM for improved asset availability
Making improvements in just about any area of business usually starts with taking some form of action. Often referred to as the proverbial “rubber meeting the road,” taking action is the catalyst to transform knowledge and understanding into meaningful outcomes. Unless action is taken, all of the data and information, analysis tools, and technology available to you is rendered useless.
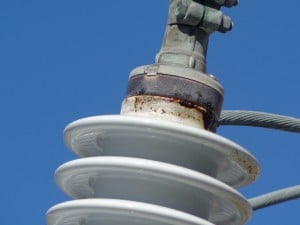 Hot spots can occur on a variety of equipment; are you combining the right data to get the key insights to act upon?
 Figure source: http://bradyinfrared.com/wp-content/uploads/2014/03/ceramic-bushing-300x225.jpg
Recommendations that become actions are one of the primary catalysts for performance improvement. It is essential to have a rigorously defined and enforced process for submitting, reviewing, approving, implementing, and tracking recommendations that are created as a result of inspections. Implementing the recommendations allows you to optimize risk, eliminate unplanned failures, identify problems early, minimize downtime, optimize cost, stay in compliance, improve safety, etc
As a vital component to sustainable performance improvement, you can gain significant value by following through on these inspection recommendations. Tracking recommended actions through completion also allows you to assess and measure the value of your overall performance improvement efforts and determine whether you are meeting your desired goals and objectives.
Ultimately, successful organizations employ a combination of advanced software, best practices, and expertise to “take action” to achieve long-term sustainable success in areas of mechanical integrity and inspection. However, establishing a strong APM foundation and focusing on the fundamentals highlighted above can generate significant value even in the early stages of an APM initiative and lay the groundwork upon which you can confidently build your APM success in the future.
Leveraging the various asset performance management steps with software helps both industry practitioners and executives develop and manage effective asset strategies while making more intelligent equipment decisions. Creating environmental and business sustainability, preserving and extending the life of capital assets, increasing asset availability and utilization, maximizing operational effectiveness, reducing fixed costs, minimizing variable costs, and empowering workers are benefits that can be achieved by using mechanical integrity and inspection data for a comprehensive asset performance initiative.
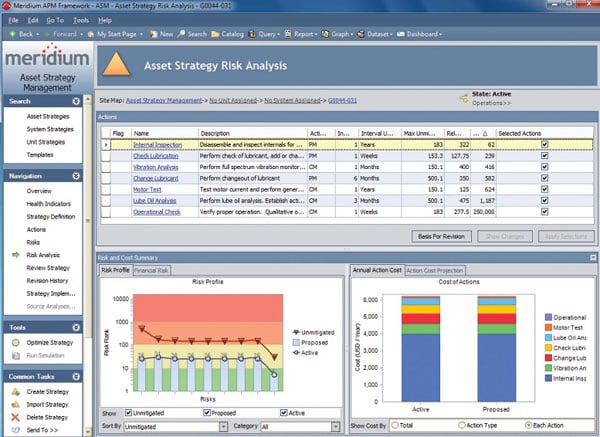 APM is a better way for the c-Suite to use the real-time information available from the shop floor.
 Figure source: https://www.meridium.com/sites/default/files/screenshots/Asset_Strategy_Management_0.jpg
About the Author Michael Warren, senior consultant at Asset Optimization Consultants, Inc. He has more than 26 years of experience in asset management, mostly spent implementing, managing, documenting, and maintaining mechanical integrity programs. In Warren's role as product manager for the mechanical integrity work process at Meridium, he has responsibility for risk-based inspection, inspection management, and thickness monitoring. Warren holds the following certifications: PMP, API 580, API 510, API 570, and API 653.
A version of this article also was published at InTech magazine.
Click here to continue reading about asset performance management at InTech magazine.


