

During my last years of working on industrial automation domain and with various industrial manufacturing customers, there have been some common requirements from all. Everyone wants to improve their performance, quality, and availability of their production’s machines to the maximum.
Availability of the machine for production is very much required for the production process—the less rejected count of the product equals a higher production value.
Performance improvement is when we identify the causes of the problems and fix or improve them on time. To achieve a better efficiency of the production process, all 3Ms must be investigated, i.e., "Man, Material, and Machines." Most of the MES applications used for this purpose and there are also custom applications developed to monitor and improve these KPIs.
Some KPIs monitored in typical production environments are listed below:
- Cycle time
- OEE (Overall Equipment Effectiveness)
- Bad/good parts count (FPY)
- Downtime and reasons for it
- TAKT time (the rate at which you need to complete a product or service to satisfy customer demand)
- MTTR (mean time to repair)
- (MTBF) the average time between system breakdowns.
Out of all these KPIs, OEE is the most important KPI, and can improve all other KPIs if improved itself. My goal is to try to help you understand this (OEE) in the following post.
The basic formula for OEE calculation is as follows:
OEE = Availability ∗ Performance ∗ Quality (A*P*Q)
As opposed to discussing what OEE is, we will instead focus on key points as to why OEE is important and what insights a customer/user gets out of it.
For me, or for any of the user, I think it is important to know what value or improvements we can achieve by knowing this KPI, as well as what internal details it can give us so that the right action can be taken at the right time to improve both efficiency and performance.
1. Let's discuss about the first parameter, "Availability" and what insights it can provide to the user.
Availability = total run time of the machine/production time planned. This means if my machine has run for 6 hours and I have planned for 8 hours, then the availability of my machine is 6 hours/8 hours, which is 0.75. We can also say as the machine's availability is 75% of time.
This indicates that the machine is not able to produce for rest of the 25% of time.
This directly indicates there may be machine breakdowns, unavailability of manpower for production, unavailability of material, timely feeding of raw material, or a plethora of other issues. We need bring out those reasons for the user so that he knows what the actual cause for the lower availability of the machine is.
2. Now let's talk about the second parameter, "Performance," and what insights it can provide to the user.
Performance of the machine is basically related to the speed loss or a comparison between the current running speed and the maximum capability (running speed) of the machine. In simple terms—my machine can produce 100 parts, but it is producing 80 parts due to various reasons.
Performance = (Ideal Cycle Time of the Machine ∗ Total Parts produced count) / (Machine Run Time)
From the above calculation regarding performance—insights like parts produced, planned production, machine run time and planned runtime are able to be discovered. If the machine is not running as per the planned time—why now? If we provide these insights to the user, it greatly helps instead of just showing a percentage value for performance.
What are the biggest reasons(loss) for the lower performance? Let’s take a look below.
Machine downtime losses:
- Machine failure or breakdown. The breakdown of the machine belongs to the downtime. These losses occur because machine failure will result in the product. Also, quantity losses
- Set up and adjustment time loss. The set up and adjustment means the losses because of the breakdown or faulty products that were produced. when the equipment stopped the on-going assembly and adjusted or set up itself to manufacture another item.
Speed losses:
- Idling and minor stoppage. The production process might be disturbed by an accident, human error, or if the equipment is idle.
- Reduction in speed. Losses occur is the speed of the machine is slower than planned.
Quality losses:
- Defects and reworks
Startup losses:
- Start-up refers to powering the machine on for production. (The time it takes to fully function and ready for production from a switched off state).
The last parameter is "Quality"—what insights it can provide to the user? Quality=produced good parts/produced total parts
Produced good part=total count of parts produced minus total bad parts produced.
The above calculation gives the quality of the parts produced on a particular machine. This parameter basically defines the FPY (First Pass Yield) of the machine. The higher the good parts produced, the higher the FPY. If quality improves, then your process and operator efficiency has been improved.
While designing and developing applications as software developers, we should look all these aspects of data and provide the insights in the reports. That way the user can analyze details and come up with a improvement plan.
The below diagram helps to to understand which data is associated and required to derive an OEE for a machine.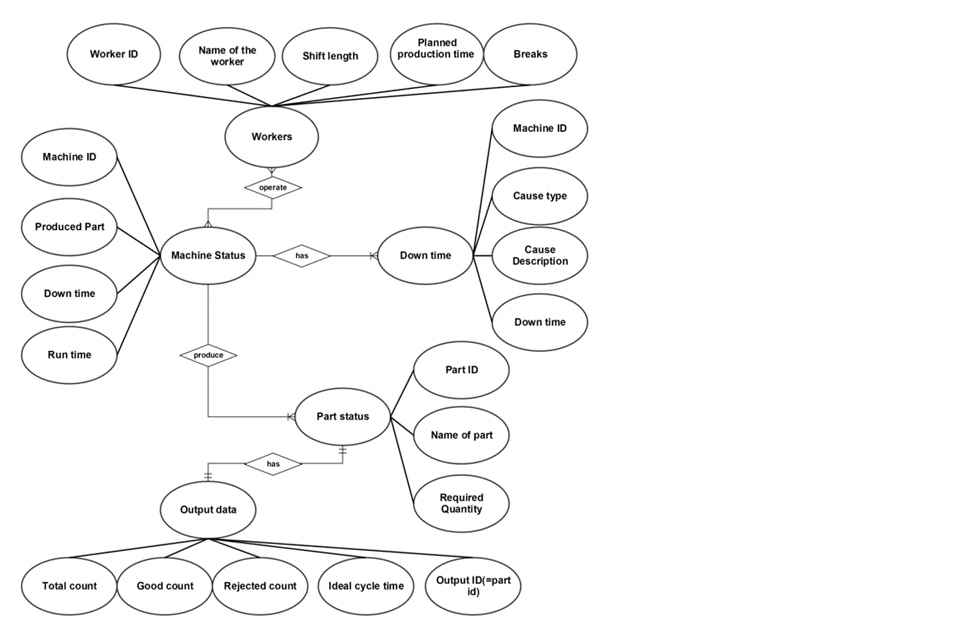
If you analyze the above ER diagram, you'll see there is a worker that can operate on one or many machines. The operator has data associated with him/her like an ID, name, shift time, and personal breaks. A machine has a unique ID, can produce parts, has downtime and runtime data associated with it.
When we talk about downtime, we also need to capture those reasons for downtime. The downtime has a reason, like machine failure, material unavailable, an operator break, etc., and the data associated with it.
I discussed these entities because while we develop an OEE, or any application related to production KPI, we need at least these data points to be captured. I hope that this article gives you some further insights.
End Note:
In the time of Industry 4.0 when many manufactures are moving towards digitalization and many of them are also very new to these production KPIs, I feel it is important for those learning to understand not only the number aspect, but also understand why the OEE is low or acceptable.
What are the causes for a lower OEE—what are the reasons for different losses? What are the areas that need to be looked for improvement, if they need to improve their process or the operator efficiency or the supply of material, quality of the raw materials, or timely maintenance of the machines, etc.
