
Industry Moving Towards Six-Nines (99.999%) Availability (source)
Service Assurance (SA) and telemetry are increasingly relevant in both 5G networks and edge deployment as network architectures evolve to become more distributed. 5G and edge networks introduce dynamic network architectures that require a level of closed loop automation and contextual service assurance for meeting service level agreements (SLAs), establishing itself as a foundational pillar in network transformation. Intelligence with machine learning (ML) algorithms and self-learning networks with artificial intelligence (AI) requires a set of open standard telemetry interfaces from various layers of the European Telecom Standards Institute (ETSI) Network Function Virtualization (NFV) model. An example of what Six Nines (99.999%) reliability looks like is seen here.
A resilient cloud requires resilient platform technologies, which include resilient CPU, resilient memory, and resilient storage technologies combined with the ability to make the rich set of platform telemetry available using open industry standard interfaces to multiple analytics methods (including classical analytics methods and ML). Self-managed and highly automated data centers require an understanding of fault detection, correction, and avoidance across multiple layers of the stack to build resilient cloud.
To achieve a level of real-time or near real-time-based closed loop automation, the NFV deployments and software-defined networking (SDN) environments require a rich set of telemetry datasets and endpoint definitions with clearly defined key performance indicators (KPIs). True automation in fault management and platform resiliency to achieve self-healing across the infrastructure at-scale could only be achieved by taking into consideration the right amount of data from a customized set of metrics relevant to the subsystem under review with an appropriate collection interval that can be processed for relevant corrective action.
Service assurance, in general, encompasses fault, configuration, accounting, performance, and security (FCAPS) components. To provide five-nines availability, the orchestration and service assurance implementation requires identifying faults and service failures in the network while maintaining critical service SLAs. Thresholds, baselines, and watermarks are established to decide the necessary actions required. End-to-end tracking of service levels is necessary to ensure conformity of subscribed service levels, which brings us to the required monitoring interfaces and analytics agents that help control agents adapt the network.
The three key elements of service assurance platforms that helps you understand the various open interfaces required to ensure truly resilient and dependable systems at-scale are:
- Monitoring Layer: The monitoring of platform and network counters to their track usage and understanding the impact of fine-tuning their configuration parameters.
- Presentation Layer: The configuration of events, notifications, alarms, and methodologies for trending and reacting to service level changes by enabling capacity changes.
- Provisioning Layer: The allocation and partition of various platform resources, network interfaces, quality of service changes, and protection mechanisms that are available to help achieve the true service assurance.
Monitoring Layer
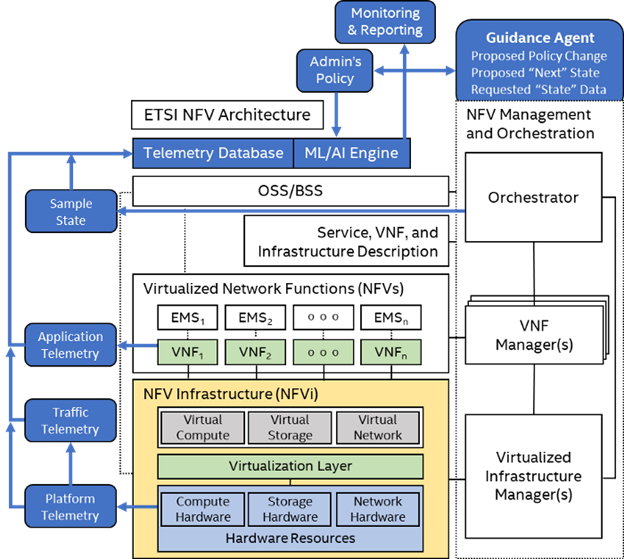 Figure 1: Various layers of telemetry in reference to the ETSI NFV model.
Multiple levels of telemetry, pertaining to the ETSI NFV model, are required to ensure resilient cloud as referred to in Figure 1:
- Platform telemetry from NFV infrastructure (NFVI),
- Traffic telemetry from various layers of physical and virtual networks,
- Application telemetry from virtual network functions (VNFs),
- Flow telemetry,
- Virtual switch telemetry,
- Transport telemetry from the Data Plane Development Kit (DPDK), and,
- Notifications/events from across management and orchestration layers with the help of open-source telemetry agents, such as Collectd.
Collectd is a mature system statistics collection mechanism widely used across the industry. We’ll go through the pluggable architecture, which allows enabling a collection of chosen metrics with read plugins and on northbound the write plugins that push data into different places like databases. Students would learn a set of newly available metrics that help identify and manage the state of NFVI and VNFs, such as:
- Hardware reliability and fault metrics,
- Procevent, an event-based plugin, that uses the Netlink library for monitoring process starts and exits, monitor network interface ups/downs, etc.,
- Intel Resource Director Technology (RDT) metrics that provides last-level cache and memory bandwidth utilization metrics,
- DPDK metrics and hugepage telemetry,
- Virtual switching metrics via Open vSwitch (OVS),
- Out-of-band telemetry using Intelligent Platform Management Interfaces (IPMIs) and Redfish plugins,
- Hypervisor metrics, including Libvirt metrics,
- VNF Event Stream (VES) schema integration and telemetry consumption,
- Flow metrics like Internet Protocol Flow Information Export (IPFIX) and sFlow,
- Simple Network Management Protocol (SNMP) telemetry for traditional network equipment,
- Platform metrics that exposes reliability, fault configurations, performance indicators, etc., and,
- A plugin to send metrics and events to an Advanced Message Queuing Protocol (AMQP) 1.0 bus.
There are pros and cons of configuring the above metrics in relation to their consumption and usage that plays a very important role in making or breaking analytics models, resource placement decisions, reliability and fault management methods, etc.
Integrations into Visualization and Analytics Layers
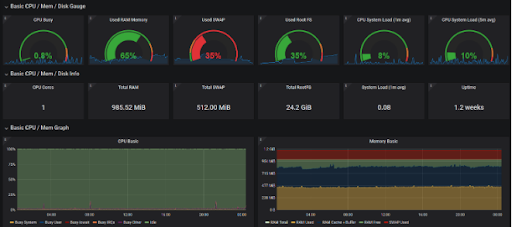 Visualization Layer Example (source)
While intelligent telemetry gathering is necessary, metrics consumption, storage, and processing play a very important role on utilizing the data. Advanced self-healing architectures that leverage remote and local corrective actions require efficient data streaming and consumption models. Collectd, for example, has been integrated into cloud-native and orchestration software including but not limited to:
- OpenStack telemetry service Ceilometer, alarm service AODH, time series database as a service (TDBaaS), Gnocchi, and root cause analysis service Vitrage.
- Prometheus monitoring and alerting toolkit that provides time series database, data modeling, and visualization. While Prometheus has not been around as long as other systems like Nagios, it seems to be a good match for many small- to large-scale operators.
- InfluxDB, an open-source time series database.
- Grafana, an open-source visualization software for time series analytics.
The Anuket Barometer project specializes in providing NFVI and VNF monitoring and helps establish industry standard interfaces for service assurance. Through Barometer, projects expose the code sources, best-known configurations, methodologies, real world use-cases, comparisons, and integration with other Anuket projects.
Provisioning Layer
The topic of monitoring and service assurance is incomplete if we do not have an analytics platform to process the data and provide indications that can be used by a Management and Orchestration (MANO) stack (such as Open Network Automation Platform [ONAP]) to provision the platform resources and network services to achieve SLA requirements. Correlating the telemetry and metrics with use-cases such as noisy neighbor detection/avoidance, fault management, local and remote corrective actions, self-healing, etc. holds the key to unlocking the value of the said data at the provisioning layer.
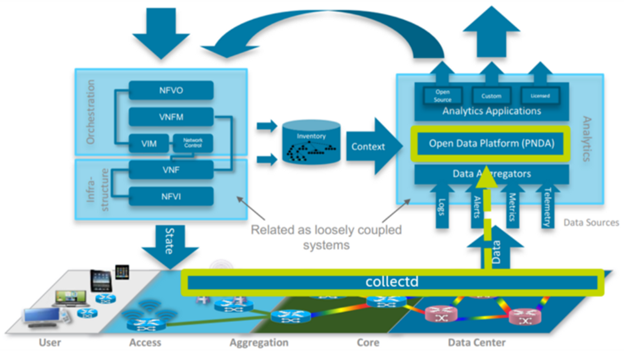 Data Consumption and Analytics using PNDA
Open-source frameworks such as Platform for Network Data & Analytics (PNDA) helps aggregate various telemetry and provides big data analytic solution for managing SDN/NFV deployments. Various components of PNDA makes it efficient and scalable for network deployments, such as Kafka, zookeeper, Apache Spark, and its integration to Logstash and OpenDaylight. PNDA is chosen to be part of ONAP as the Data Correlation and Analytics Engine (DCAE) component of choice. One can do a lab exercise to understand PNDA better through deployment of RedPNDA, a smaller subset of PNDA components that helps users get familiar with data ingestion and data exploration, while leveraging Collectd metrics using the Avro format.
Use-cases of reliability and resiliency of cloud infrastructure can be achieved by utilizing key telemetry of memory and solid-state drives to build a prediction model for failures and proactive remediation mechanisms, optimizing workload co-location through analysis for node detection with automation back to an orchestrator.
Editor’s Note: This article was originally written by Sunku Ranganath, Matthias Runge, and Josh Hilliker. All rights reserved. A version of this article originally appeared in Medium.
This article is a product of the International Society of Automation (ISA) Smart Manufacturing & IIoT Division. If you are an ISA member and are interested in joining this division, please email info@isa.org.